

BNS trades flat as seller pressure limits upside

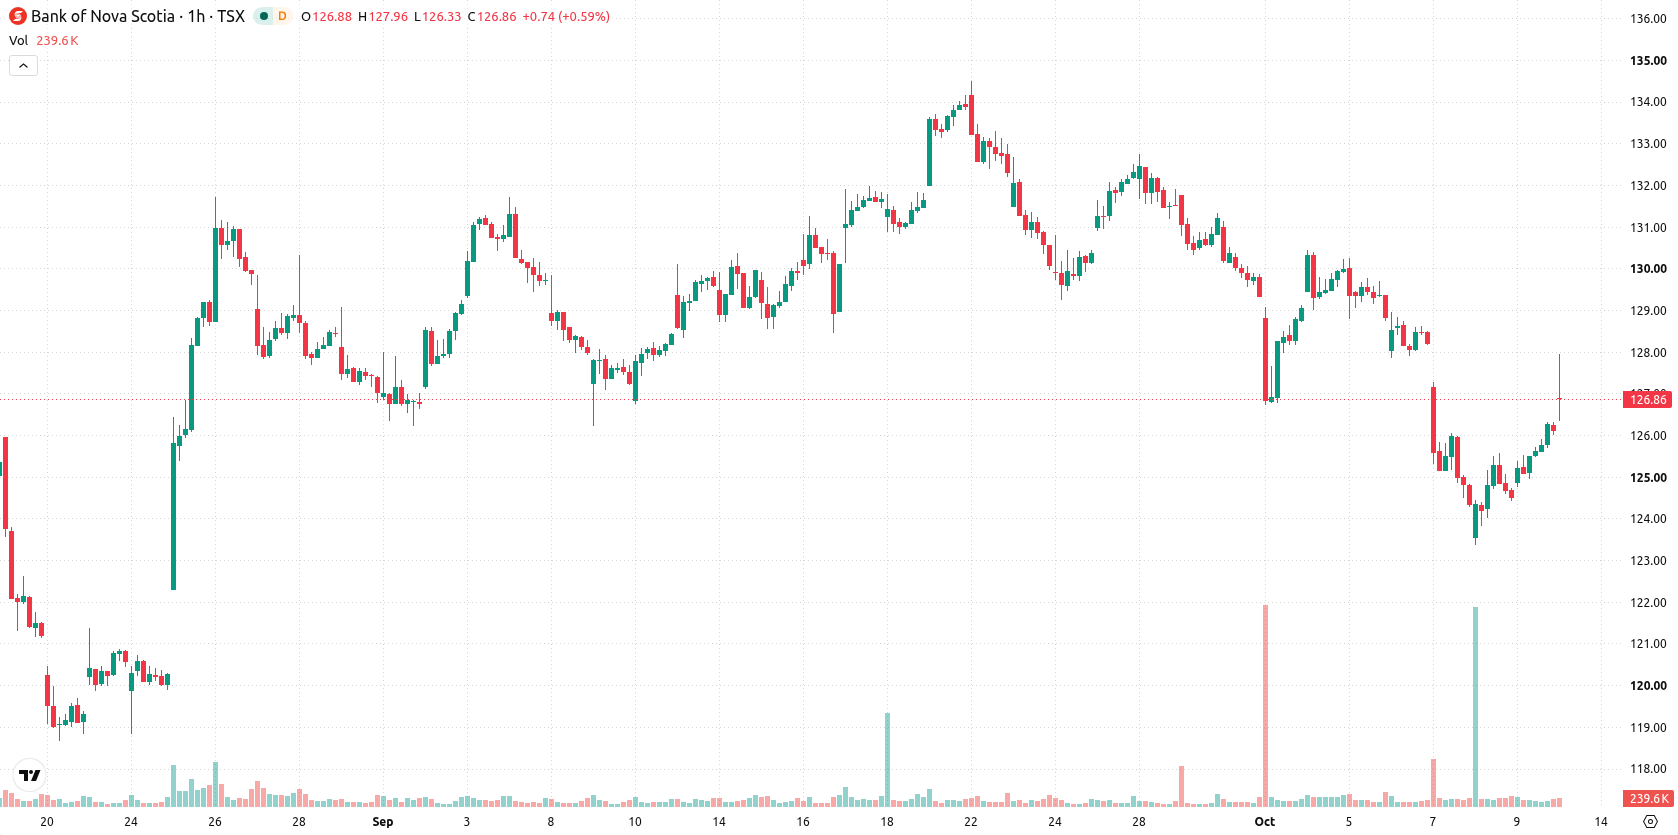
Scotiabank (BNS) stock is trading at C$127.07, marking a modest daily gain. The stock sits above its key short-term moving average but just below a longer-term average, showing support from underlying trends.
 131.88
134.44
Highlights
- Scotia Wealth Management launched Scotia Global Intelligence, expanding specialized advisory and alternative investments for ultra-high-net-worth clients in Canada.
- The Bank of Nova Scotia increased its share buyback authorization to 40 million shares and raised its quarterly dividend, benefiting shareholders directly.
- Shares of the Bank of Nova Scotia are expected to fluctuate between C$125.41 and C$128.73, with technical indicators showing rangebound trade and a 68% probability of downside.
Wealth platform launch and capital returns boost revenue outlook
Scotia Wealth Management, a division of Scotiabank, launched Scotia Global Intelligence in early October, introducing specialized advisory and access to alternative investments for ultra-high-net-worth individuals and families in Canada, according to Kalkinemedia. This development expands the bank's wealth management offerings while reaching a premium client segment, potentially supporting fee-based revenue growth. In addition, the Bank of Nova Scotia has increased its share buyback authorization to 40 million shares and raised its quarterly dividend, providing direct benefits to shareholders and highlighting its commitment to capital returns.
Near-term support holds as momentum and signals point to exhaustion
BNS is trading above its MA-20 at C$125.12, but remains just below the MA-50 at C$127.31 on the hourly chart. On the daily timeframe, the stock is well above the MA-200 at C$112.34, indicating solid long-term support. The immediate Ichimoku Kijun level stands at C$126.04 as a key near-term support. Technical momentum is weak, with MACD signaling Strong Sell and ADX on Sell, reflecting persistent downward pressure. RSI is at 49.86 (Sell), and Stoch RSI, CCI, and Bull/Bear Power are in overbought territory, pointing to active buying but possible exhaustion, while the Awesome Oscillator shows neutral momentum. Bull/Bear Power confirms that buyers retain the upper hand in intraday moves.
Rangebound trading favored as downside probability outweighs breakout risk
Over the next several days, BNS is expected to trade within a typical volatility range of C$125.41 to C$128.73. The probability of a further decline is assessed at 68%, suggesting that the price is more likely to remain rangebound rather than attempt a breakout to the upside. A move above C$128.73 would be needed to establish a bullish scenario toward the upper band, while a bearish scenario could develop on a breakdown below C$126.04, opening a path to test lower support levels.
Previously it was reported that analysts highlighted downside risk for Scotiabank shares amid bearish technical momentum despite supportive corporate actions. The current analysis strengthens this perspective with persistent sell signals and overbought conditions, with traders advised to closely monitor C$128.73 as a critical resistance level for any potential bullish shift.






Latest Bank of Nova Scotia News




-
 Afghanistan
-
 Albania
-
 Algeria
-
 Angola
-
 Argentina
-
 Armenia
-
 Australia
-
 Austria
-
 Azerbaijan
-
 Bahamas
-
 Bahrain
-
 Bangladesh
-
 Belarus
-
 Belgium
-
 Bolivia
-
 Botswana
-
 Brazil
-
 Brunei
-
 Bulgaria
-
 Cambodia
-
 Cameroon
-
 Canada
-
 Chile
-
 China
-
 Colombia
-
 Congo
-
 Costa Rica
-
 Cote d'Ivoire
-
 Croatia
-
 Cuba
-
 Cyprus
-
 Czechia
-
 DR Congo
-
 Denmark
-
 Dominican Republic
-
 Ecuador
-
 Egypt
-
 El Salvador
-
 Estonia
-
 Eswatini
-
 Ethiopia
-
 Finland
-
 France
-
 Georgia
-
 Germany
-
 Ghana
-
 Greece
-
 Haiti
-
 Hong Kong
-
 Hungary
-
 India
-
 Indonesia
-
 Iran, Islamic republic
-
 Iraq
-
 Ireland
-
 Israel
-
 Italy
-
 Jamaica
-
 Japan
-
 Jordan
-
 Kazakhstan
-
 Kenya
-
 Korea
-
 Kuwait
-
 Kyrgyzstan
-
 Laos
-
 Latvia
-
 Lebanon
-
 Lesotho
-
 Libya
-
 Lithuania
-
 Luxembourg
-
 Madagascar
-
 Malaysia
-
 Malta
-
 Mauritius
-
 Mexico
-
 Moldova
-
 Mongolia
-
 Montenegro
-
 Morocco
-
 Mozambique
-
 Myanmar
-
 Namibia
-
 Nepal
-
 Netherlands
-
 New Zealand
-
 Nigeria
-
 North Macedonia
-
 Norway
-
 Oman
-
 Pakistan
-
 Palestine
-
 Panama
-
 Papua New Guinea
-
 Paraguay
-
 Peru
-
 Philippines
-
 Poland
-
 Portugal
-
 Puerto Rico
-
 Qatar
-
 Reunion
-
 Romania
-
 Rwanda
-
 Saudi Arabia
-
 Serbia
-
 Singapore
-
 Slovakia
-
 Slovenia
-
 Somalia
-
 South Africa
-
 Spain
-
 Sri Lanka
-
 Sweden
-
 Switzerland
-
 Syria
-
 Taiwan
-
 Tajikistan
-
 Tanzania
-
 Thailand
-
 Trinidad and Tobago
-
 Tunisia
-
 Turkey
-
 UAE
-
 Uganda
-
 Ukraine
-
 United Kingdom
-
United States
-
 Uruguay
-
 Uzbekistan
-
 Venezuela
-
 Vietnam
-
 Yemen
-
 Zambia
-
 Zimbabwe
- Forex
- Crypto












