

Reckitt Benckiser shares technical analysis: Overbought conditions limit further upside near resistance

Reckitt Benckiser (RKT) stock is trading at GBX5,302, showing a modest increase on the day and remaining above its key moving averages.
 5554.00
5512.00
5554.00
5512.00
Highlights
- Shares of Reckitt Benckiser advanced within the FTSE 100 due to sector rotation favoring banks and defence stocks, with no company-specific announcement.
- The recent stock price move is attributed to broader market dynamics rather than a firm-specific catalyst.
- RKT price stands at GBX5,302 within a projected range of GBX5,175 to GBX5,428, supported by bullish momentum but with oscillators indicating both overbought and oversold conditions.
FTSE rotation fuels RKT rally amid absence of company news
Reckitt Benckiser has recently seen gains within the FTSE 100, attributable to a broad rotation led by banks and defence stocks, according to Kalkinemedia. In the absence of any specific company announcement, the upward movement in RKT appears connected to external sector shifts rather than a corporate catalyst. This context suggests that recent price action reflects overall market dynamics instead of changes within the firm.
Divergent oscillator signals as price tests technical boundaries
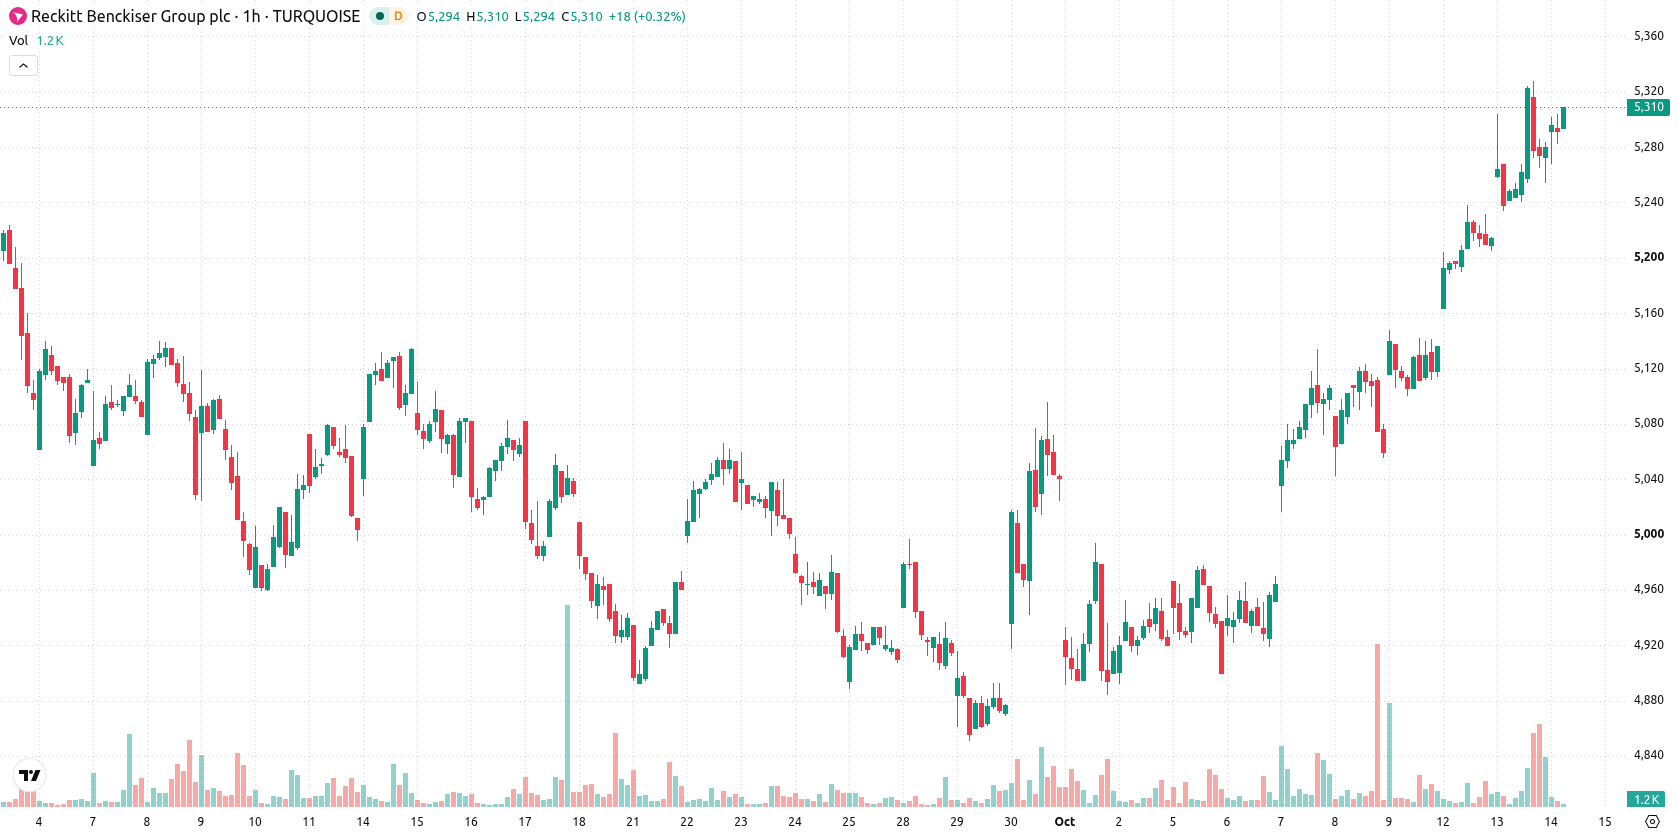
On the hourly chart, RKT is above the MA-20 at GBX5,243 and MA-50 at GBX5,148, while on the daily it trades above the MA-200 at GBX5,263. The Ichimoku Kijun at GBX5,214 acts as immediate support. Intraday, MACD signals a Strong Buy and ADX points to a Buy, with RSI at 66.18 in Buy territory. However, CCI and Bull/Bear Power are both overbought, whereas Stoch RSI presents oversold conditions, resulting in a notable divergence among oscillators. The session opened with a gap of 20 and is trading near the high amid low volatility, indicating buyer-dominated short-term momentum but warranting caution due to mixed oscillator readings.
Further consolidation likely as volatility bands cap near-term moves
For the next several sessions, RKT is expected to consolidate within the GBX5,175 to GBX5,428 range, representing the typical volatility band relative to current levels. The baseline scenario envisions continued movement inside this corridor. A breakout above resistance could drive further upside momentum, while a drop below the support zone would risk triggering a correction, though downside risk presently appears limited.
Earlier, analysts noted that Reckitt Benckiser’s share buyback activity was providing short-term support despite mixed technical signals and overbought conditions. The current technical divergence suggests that while short-term buyer momentum persists, traders should watch for a potential breakout above GBX5,428 or a reversal below GBX5,175 as signals for the next directional move.










-
 Afghanistan
-
 Albania
-
 Algeria
-
 Angola
-
 Argentina
-
 Armenia
-
 Australia
-
 Austria
-
 Azerbaijan
-
 Bahamas
-
 Bahrain
-
 Bangladesh
-
 Belarus
-
 Belgium
-
 Bolivia
-
 Botswana
-
 Brazil
-
 Brunei
-
 Bulgaria
-
 Cambodia
-
 Cameroon
-
 Canada
-
 Chile
Chile
-
 China
China
-
 Colombia
-
 Congo
Congo
-
 Costa Rica
-
 Cote d'Ivoire
-
 Croatia
-
 Cuba
Cuba
-
 Cyprus
-
 Czechia
-
 DR Congo
-
 Denmark
-
 Dominican Republic
-
 Ecuador
-
 Egypt
Egypt
-
 El Salvador
-
 Estonia
-
 Eswatini
-
 Ethiopia
-
 Finland
-
 France
-
 Georgia
-
 Germany
-
 Ghana
Ghana
-
 Greece
-
 Haiti
Haiti
-
 Hong Kong
-
 Hungary
-
 India
India
-
 Indonesia
-
 Iran, Islamic republic
-
 Iraq
Iraq
-
 Ireland
-
 Israel
-
 Italy
Italy
-
 Jamaica
-
 Japan
Japan
-
 Jordan
-
 Kazakhstan
-
 Kenya
Kenya
-
 Korea
Korea
-
 Kuwait
-
 Kyrgyzstan
-
 Laos
Laos
-
 Latvia
-
 Lebanon
-
 Lesotho
-
 Libya
Libya
-
 Lithuania
-
 Luxembourg
-
 Madagascar
-
 Malaysia
-
 Malta
Malta
-
 Mauritius
-
 Mexico
-
 Moldova
-
 Mongolia
-
 Montenegro
-
 Morocco
-
 Mozambique
-
 Myanmar
-
 Namibia
-
 Nepal
Nepal
-
 Netherlands
-
 New Zealand
-
 Nigeria
-
 North Macedonia
-
 Norway
-
 Oman
Oman
-
 Pakistan
-
 Palestine
-
 Panama
-
 Papua New Guinea
-
 Paraguay
-
 Peru
Peru
-
 Philippines
-
 Poland
-
 Portugal
-
 Puerto Rico
-
 Qatar
Qatar
-
 Reunion
-
 Romania
-
 Rwanda
-
 Saudi Arabia
-
 Serbia
-
 Singapore
-
 Slovakia
-
 Slovenia
-
 Somalia
-
 South Africa
-
 Spain
Spain
-
 Sri Lanka
-
 Sweden
-
 Switzerland
-
 Syria
Syria
-
 Taiwan
-
 Tajikistan
-
 Tanzania
-
 Thailand
-
 Trinidad and Tobago
-
 Tunisia
-
 Turkey
-
 UAE
UAE
-
 Uganda
-
 Ukraine
-
 United Kingdom
-
United States
-
 Uruguay
-
 Uzbekistan
-
 Venezuela
-
 Vietnam
-
 Yemen
Yemen
-
 Zambia
-
 Zimbabwe
- Forex
- Crypto












