


NRG Energy Inc (NRG) plunged 5.68% under intensified seller pressure, as bearish technical momentum and downside volatility took control in the absence of any fresh news catalyst. The move is reinforced by the stock trading below all key moving averages, confirming ongoing selling pressure across short-, medium-, and long-term trends.
 99.31
99.88
Highlights
- Shares of NRG Energy closed at $101.09, slipping 5.68% lower on the session and trading below key moving averages.
- Immediate support is at $100.66 with resistance at $102.05, with a projected five-day range of $94.61 to $103.9.
- Technical indicators show a bearish medium- and long-term trend, with mixed momentum signals and intraday overbought conditions.
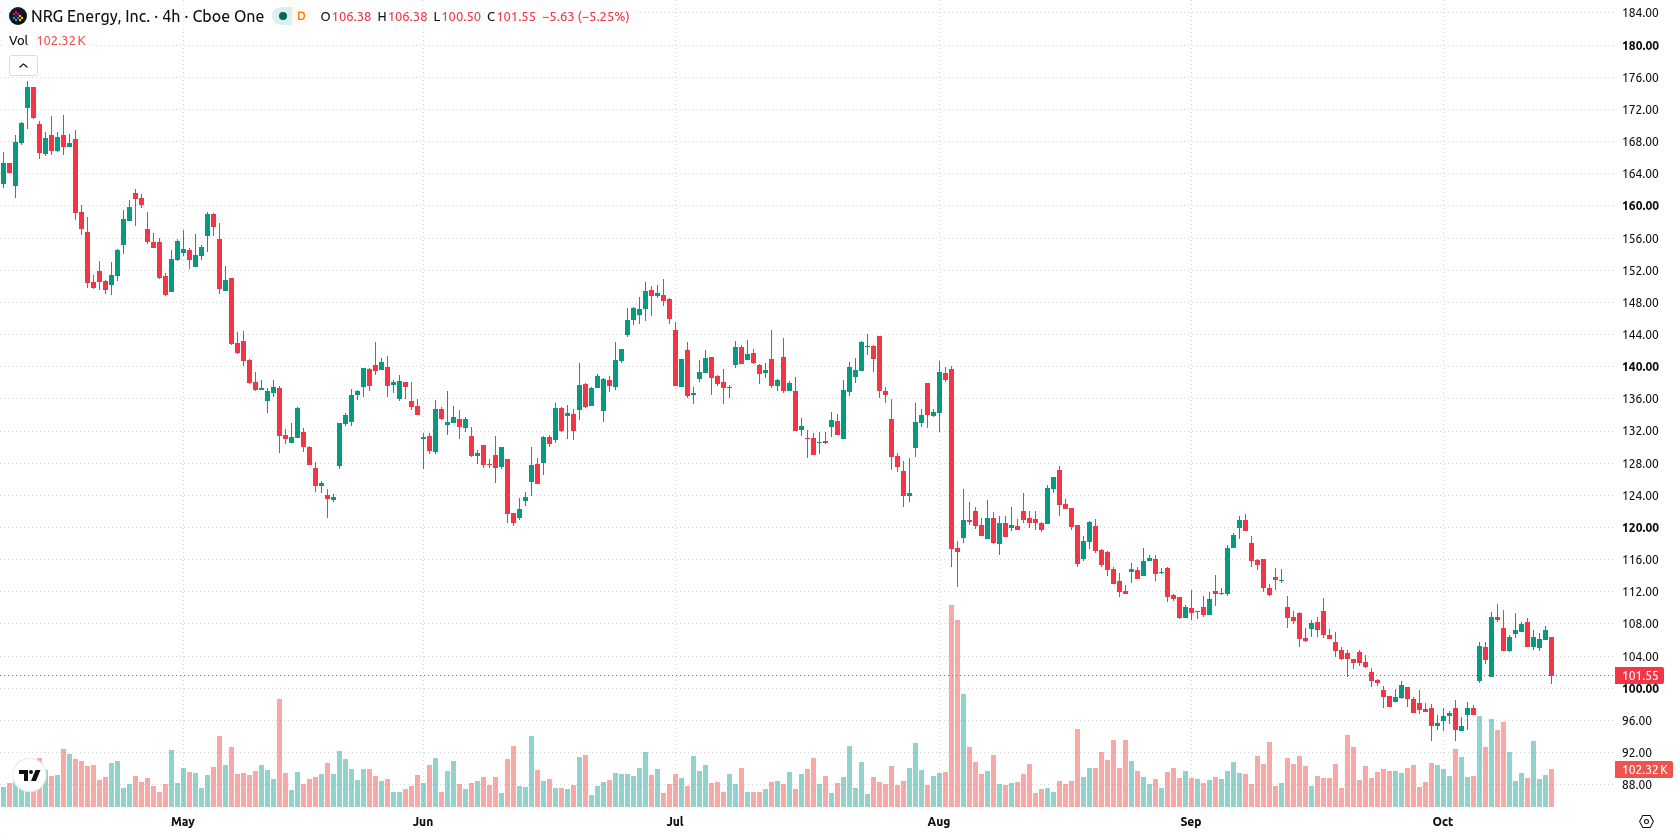
Bearish signals dominate as price clings to session lows
NRG Energy is trading at $101.09, below the 20-day ($102.05), 50-day ($110.23), and 200-day ($139.06) moving averages, indicating seller pressure across all timeframes. Immediate support is marked by the near-term floor at $100.66, with resistance at the near-term ceiling of $102.05. Medium- and long-term trend direction remains bearish. Momentum signals are mixed: the MACD forecasts "Strong Sell" and the ADX is neutral, suggesting a lack of strong trend direction. RSI and CCI both highlight mild buying interest, yet Stochastic RSI and BBP flag overbought conditions with buyers dominating intraday momentum. Daily price action is negative, with NRG slipping $6.09 or 5.68% after opening with a downside gap of roughly $1.01, or 0.94%. Price is holding near the session low and intraday volatility stands at 5.68%. The tone is pressured as sellers control direction after the gap, despite some conflicting momentum indicators.
Earlier, analysts noted that NRG Energy remained entrenched in a sustained bearish trend amid persistent selling pressure and technical resistance. The current decline, marked by heightened volatility and a potential break below $100.66 support, reinforces the bearish outlook and calls for close monitoring of further downside risk toward the $94.61 level in the coming days.









-
 Afghanistan
-
 Albania
-
 Algeria
-
 Angola
-
 Argentina
-
 Armenia
-
 Australia
-
 Austria
-
 Azerbaijan
-
 Bahamas
-
 Bahrain
-
 Bangladesh
-
 Belarus
-
 Belgium
-
 Bolivia
-
 Botswana
-
 Brazil
-
 Brunei
-
 Bulgaria
-
 Cambodia
-
 Cameroon
-
 Canada
-
 Chile
-
 China
-
 Colombia
-
 Congo
-
 Costa Rica
-
 Cote d'Ivoire
-
 Croatia
-
 Cuba
-
 Cyprus
-
 Czechia
-
 DR Congo
-
 Denmark
-
 Dominican Republic
-
 Ecuador
-
 Egypt
-
 El Salvador
-
 Estonia
-
 Eswatini
-
 Ethiopia
-
 Finland
-
 France
-
 Georgia
-
 Germany
-
 Ghana
-
 Greece
-
 Haiti
-
 Hong Kong
-
 Hungary
-
 India
-
 Indonesia
-
 Iran, Islamic republic
-
 Iraq
-
 Ireland
-
 Israel
-
 Italy
-
 Jamaica
-
 Japan
-
 Jordan
-
 Kazakhstan
-
 Kenya
-
 Korea
-
 Kuwait
-
 Kyrgyzstan
-
 Laos
-
 Latvia
-
 Lebanon
-
 Lesotho
-
 Libya
-
 Lithuania
-
 Luxembourg
-
 Madagascar
-
 Malaysia
-
 Malta
-
 Mauritius
-
 Mexico
-
 Moldova
-
 Mongolia
-
 Montenegro
-
 Morocco
-
 Mozambique
-
 Myanmar
-
 Namibia
-
 Nepal
-
 Netherlands
-
 New Zealand
-
 Nigeria
-
 North Macedonia
-
 Norway
-
 Oman
-
 Pakistan
-
 Palestine
-
 Panama
-
 Papua New Guinea
-
 Paraguay
-
 Peru
-
 Philippines
-
 Poland
-
 Portugal
-
 Puerto Rico
-
 Qatar
-
 Reunion
-
 Romania
-
 Rwanda
-
 Saudi Arabia
-
 Serbia
-
 Singapore
-
 Slovakia
-
 Slovenia
-
 Somalia
-
 South Africa
-
 Spain
-
 Sri Lanka
-
 Sweden
-
 Switzerland
-
 Syria
-
 Taiwan
-
 Tajikistan
-
 Tanzania
-
 Thailand
-
 Trinidad and Tobago
-
 Tunisia
-
 Turkey
-
 UAE
-
 Uganda
-
 Ukraine
-
 United Kingdom
-
United States
-
 Uruguay
-
 Uzbekistan
-
 Venezuela
-
 Vietnam
-
 Yemen
-
 Zambia
-
 Zimbabwe
- Forex
- Crypto












