

UiPath shares technical analysis: Downward price move and overbought conditions signal ongoing volatility

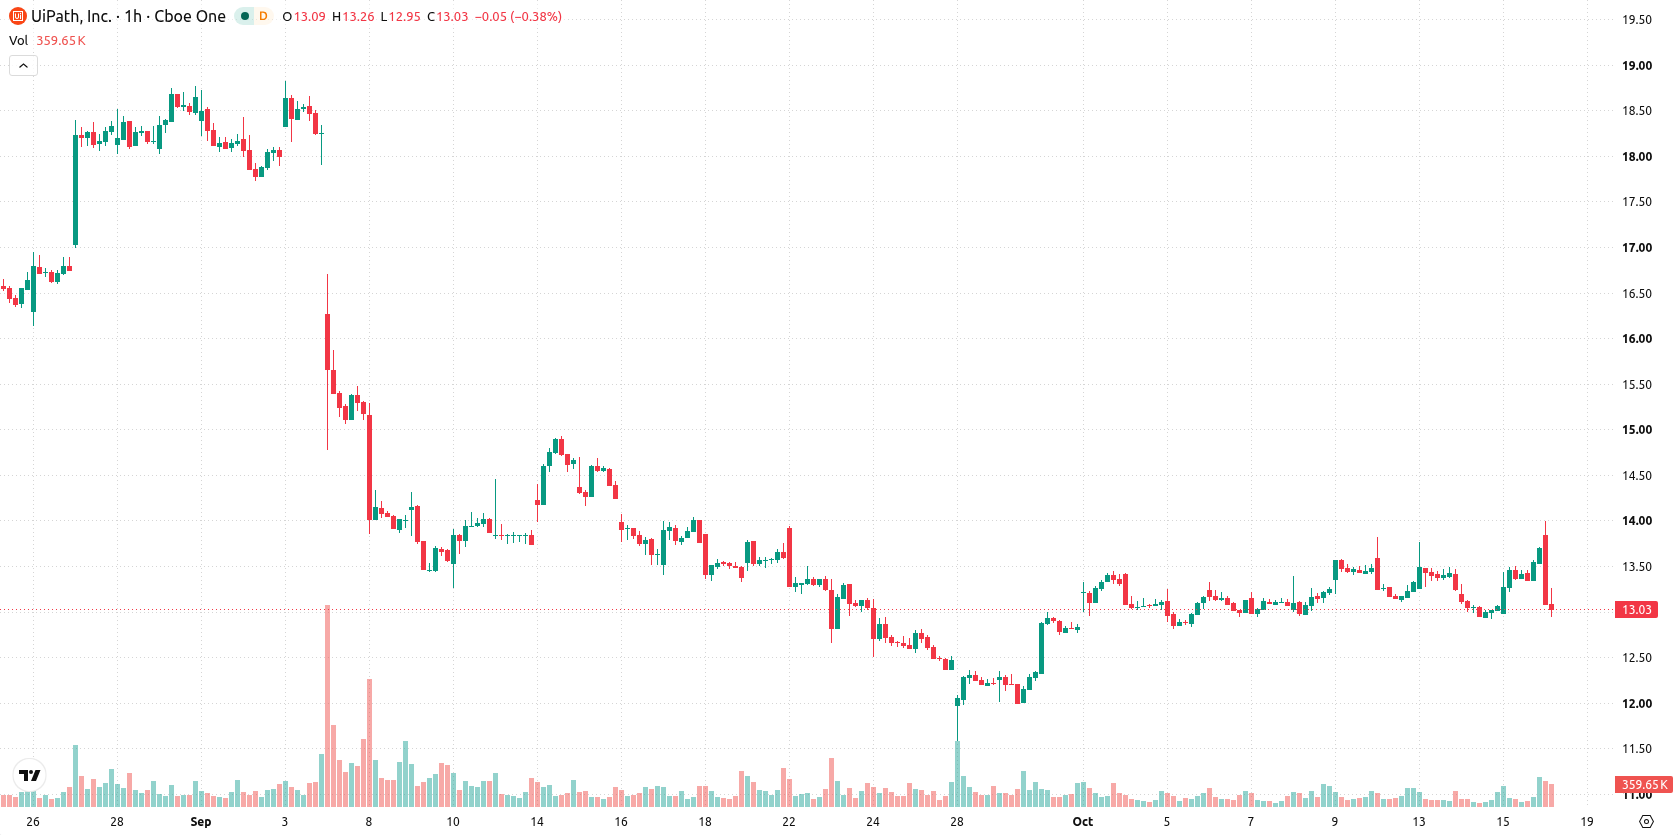
UiPath Inc. (PATH) stock is trading at $13.06, down 4.67% on the day. The price ended the session below its short- and medium-term moving averages but remains above its longer-term trend levels.
 13.62
13.92
Highlights
- UiPath set targets for long-term gross margins above 80% and operating margins over 30%, prioritizing scalability and profitability.
- The company introduced new offerings like Coding Agents and a Linux Automation Suite, expanding its platform and addressing security-focused enterprise buyers.
- Shares of UiPath fell 4.67% to $13.06 under selling pressure, with technical indicators showing short- and medium-term weakness and an expected trading range of $12.67 to $13.58.
Strategic partnerships and new products drive growth aims amid selloff
UiPath Inc. set long-term targets for gross margins above 80% and operating margins exceeding 30%, framing its operational outlook around scalability and profitability, according to StocksToTrade. Management also announced a series of product enhancements, such as Coding Agents and a full Linux on-prem Automation Suite designed for security-sensitive clients, aiming to expand the addressable enterprise market. In addition, UiPath broadened its partnership with Snowflake to facilitate automations from Snowflake's governed data cloud, and extended its collaboration with BDO USA to address internal audit and compliance workflows. These developments signal strategic positioning for growth, though price action has remained under broader selling pressure.
Diverging signals as bullish momentum meets overbought conditions
On the technical front, PATH is currently positioned below the MA-20 and MA-50 moving averages on the working timeframe, while still sitting above the MA-200 on the daily chart. Immediate resistance is marked by the Ichimoku Kijun at $13.34. On the hourly chart, MACD and ADX point to bullish momentum, and the Awesome Oscillator is rising, but overbought conditions are evident on RSI, Stochastic RSI, and CCI. Bull/Bear Power indicates buyers retain an advantage, yet the strong divergence between upward momentum indicators and the day's downside close highlights ongoing volatility and uncertainty at current levels.
Downside favored as range-bound action reflects heightened volatility
In the near term, PATH is expected to fluctuate within a range of $12.67 to $13.58 over the next two to three trading days, reflecting typical volatility. Scenario analysis favors a move lower, with a 65% probability assigned to further downside. The baseline expectation is for sideways action within this band, with an upside breakout above $13.34 possibly triggering additional gains, while a drop below $12.67 would likely increase selling pressure.
Earlier, analysts noted that UiPath shares were consolidating after strong momentum and insider activity created a wait-and-see technical outlook. The current environment highlights heightened volatility and a greater likelihood of near-term downside risk, with the key level to monitor being $13.34 for any potential shift in trend.









-
 Afghanistan
-
 Albania
-
 Algeria
-
 Angola
-
 Argentina
-
 Armenia
-
 Australia
-
 Austria
-
 Azerbaijan
-
 Bahamas
-
 Bahrain
-
 Bangladesh
-
 Belarus
-
 Belgium
-
 Bolivia
-
 Botswana
-
 Brazil
-
 Brunei
-
 Bulgaria
-
 Cambodia
-
 Cameroon
-
 Canada
-
 Chile
-
 China
-
 Colombia
-
 Congo
-
 Costa Rica
-
 Cote d'Ivoire
-
 Croatia
-
 Cuba
-
 Cyprus
-
 Czechia
-
 DR Congo
-
 Denmark
-
 Dominican Republic
-
 Ecuador
-
 Egypt
-
 El Salvador
-
 Estonia
-
 Eswatini
-
 Ethiopia
-
 Finland
-
 France
-
 Georgia
-
 Germany
-
 Ghana
-
 Greece
-
 Haiti
-
 Hong Kong
-
 Hungary
-
 India
-
 Indonesia
-
 Iran, Islamic republic
-
 Iraq
-
 Ireland
-
 Israel
-
 Italy
-
 Jamaica
-
 Japan
-
 Jordan
-
 Kazakhstan
-
 Kenya
-
 Korea
-
 Kuwait
-
 Kyrgyzstan
-
 Laos
-
 Latvia
-
 Lebanon
-
 Lesotho
-
 Libya
-
 Lithuania
-
 Luxembourg
-
 Madagascar
-
 Malaysia
-
 Malta
-
 Mauritius
-
 Mexico
-
 Moldova
-
 Mongolia
-
 Montenegro
-
 Morocco
-
 Mozambique
-
 Myanmar
-
 Namibia
-
 Nepal
-
 Netherlands
-
 New Zealand
-
 Nigeria
-
 North Macedonia
-
 Norway
-
 Oman
-
 Pakistan
-
 Palestine
-
 Panama
-
 Papua New Guinea
-
 Paraguay
-
 Peru
-
 Philippines
-
 Poland
-
 Portugal
-
 Puerto Rico
-
 Qatar
-
 Reunion
-
 Romania
-
 Rwanda
-
 Saudi Arabia
-
 Serbia
-
 Singapore
-
 Slovakia
-
 Slovenia
-
 Somalia
-
 South Africa
-
 Spain
-
 Sri Lanka
-
 Sweden
-
 Switzerland
-
 Syria
-
 Taiwan
-
 Tajikistan
-
 Tanzania
-
 Thailand
-
 Trinidad and Tobago
-
 Tunisia
-
 Turkey
-
 UAE
-
 Uganda
-
 Ukraine
-
 United Kingdom
-
United States
-
 Uruguay
-
 Uzbekistan
-
 Venezuela
-
 Vietnam
-
 Yemen
-
 Zambia
-
 Zimbabwe
- Forex
- Crypto












