


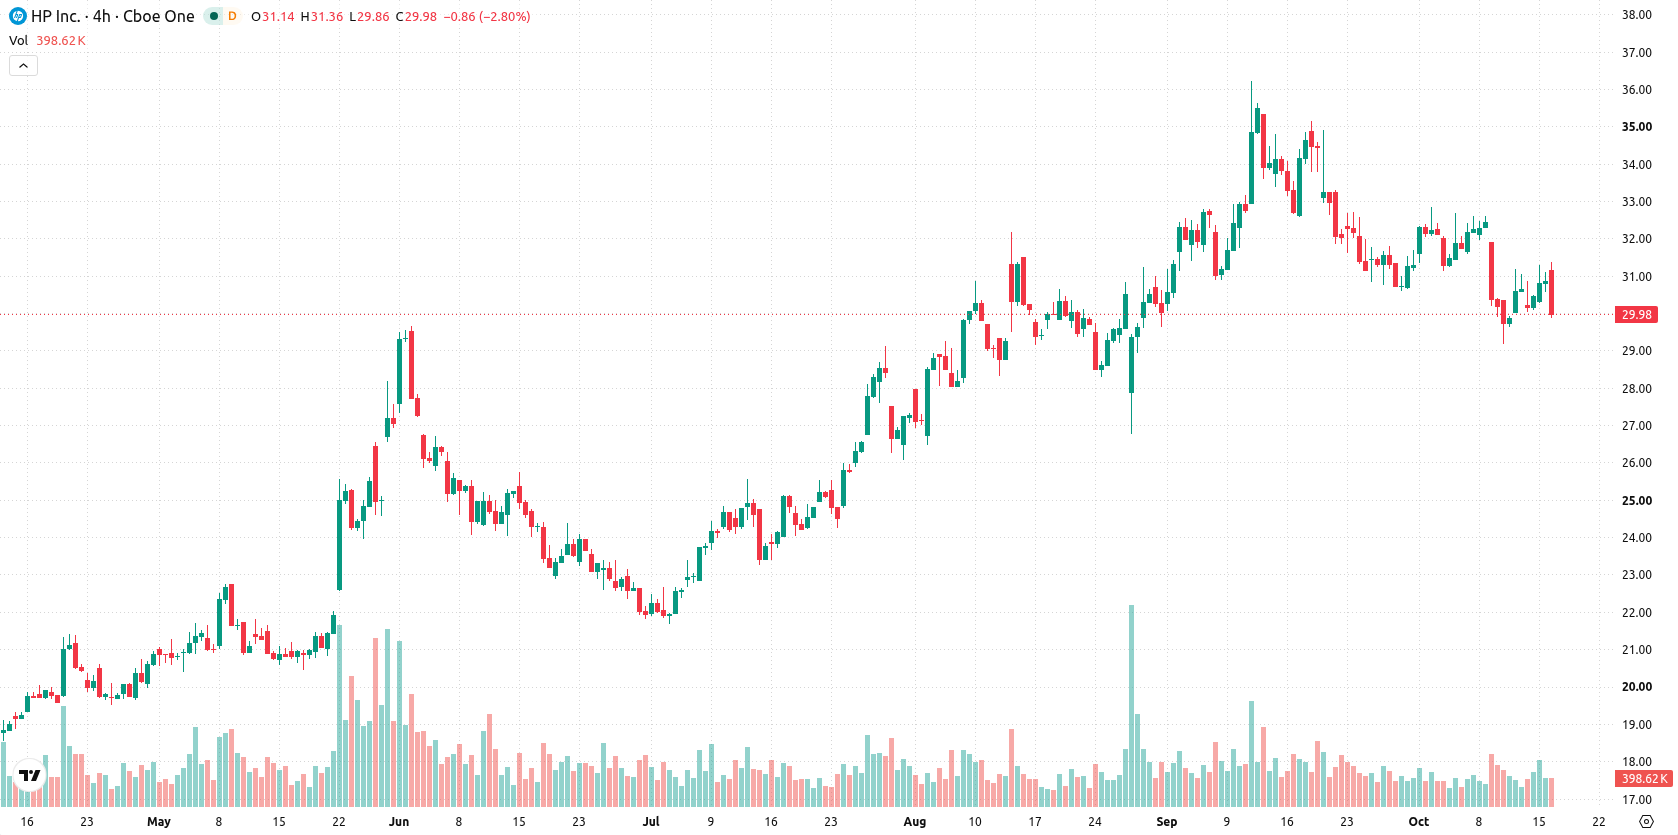
HP Inc. (HPQ) fell 3.16% as sellers dominated the session, even as the company reported higher Q3 2026 earnings and revenue amid industry supply improvements. The move is supported by pressured short- and medium-term trends, with HP currently below its 20-day and 50-day moving averages and momentum indicators flashing bearish signals.
 29.89
34.09
Highlights
- HP Inc. reported Q3 2026 revenue of $15.7 billion and non-GAAP diluted EPS of $0.83, both increasing year over year.
- The company is expanding PC and services offerings to include hybrid AI workloads and recurring software revenue amid improved supply conditions.
- Shares of HP stock traded below near-term moving averages, pressured by bearish technical signals and are expected to remain within a $28.84 to $30.92 range over five days.
Broader selling persists despite improved revenue and AI strategy rollout
HP Inc. reported Q3 2026 revenue of $15.7 billion and a non-GAAP diluted EPS of $0.83, both showing year-over-year increases. Executives noted improvements in memory supply and fulfillment rates, linked to ongoing strategies addressing environmental constraints. The company is also expanding its PC and services offerings to include hybrid AI workload capabilities and recurring software revenue, though price action has remained under broader selling pressure.
Bearish momentum dominates as technical barriers cap rebound attempts
HP is trading at $29.88, currently positioned below its 20-day ($31.58) and 50-day ($31.23) moving averages, but remains well above the 200-day ($23.97), which confirms longer-term bullish structure in the stock. Short- and medium-term trends are under pressure from sellers, with the next near-term ceiling at $30.42 and support defined by the week’s low at $29.2. Momentum indicators show a negative tone, as both the MACD and the RSI align with sell signals, and the ADX indicates a neutral trend. The CCI and the RSI both suggest bearish momentum and a risk of short-term oversold conditions, while Stochastic RSI is neutral. Bull/Bear Power (BBP) is positive, showing buyer dominance on the day, but with an "Oversold" bias. The Awesome Oscillator (AO) is negative and reinforces the bearish short-term picture. HP opened with an upside gap of about $0.21 (0.68%) but has since declined $0.975 or 3.16%, now sitting near the session’s low. Intraday volatility stands at 3.12%. The tone is notably pressured after the open, in line with the prevailing bearish momentum.
Earlier, analysts noted that skepticism around the sustainability of hardware-driven gains in the AI infrastructure sector had increased amid shifting enterprise spending patterns. In the context of HP's recent technical weakness despite improved earnings, traders should watch for a potential downside break below $29.2, which could usher in increased volatility and further test the stock's longer-term uptrend.











-
 Afghanistan
-
 Albania
-
 Algeria
-
 Angola
-
 Argentina
-
 Armenia
-
 Australia
-
 Austria
-
 Azerbaijan
-
 Bahamas
-
 Bahrain
-
 Bangladesh
-
 Belarus
-
 Belgium
-
 Bolivia
-
 Botswana
-
 Brazil
-
 Brunei
-
 Bulgaria
-
 Cambodia
-
 Cameroon
-
 Canada
-
 Chile
-
 China
-
 Colombia
-
 Congo
-
 Costa Rica
-
 Cote d'Ivoire
-
 Croatia
-
 Cuba
-
 Cyprus
-
 Czechia
-
 DR Congo
-
 Denmark
-
 Dominican Republic
-
 Ecuador
-
 Egypt
-
 El Salvador
-
 Estonia
-
 Eswatini
-
 Ethiopia
-
 Finland
-
 France
-
 Georgia
-
 Germany
-
 Ghana
-
 Greece
-
 Haiti
-
 Hong Kong
-
 Hungary
-
 India
-
 Indonesia
-
 Iran, Islamic republic
-
 Iraq
-
 Ireland
-
 Israel
-
 Italy
-
 Jamaica
-
 Japan
-
 Jordan
-
 Kazakhstan
-
 Kenya
-
 Korea
-
 Kuwait
-
 Kyrgyzstan
-
 Laos
-
 Latvia
-
 Lebanon
-
 Lesotho
-
 Libya
-
 Lithuania
-
 Luxembourg
-
 Madagascar
-
 Malaysia
-
 Malta
-
 Mauritius
-
 Mexico
-
 Moldova
-
 Mongolia
-
 Montenegro
-
 Morocco
-
 Mozambique
-
 Myanmar
-
 Namibia
-
 Nepal
-
 Netherlands
-
 New Zealand
-
 Nigeria
-
 North Macedonia
-
 Norway
-
 Oman
-
 Pakistan
-
 Palestine
-
 Panama
-
 Papua New Guinea
-
 Paraguay
-
 Peru
-
 Philippines
-
 Poland
-
 Portugal
-
 Puerto Rico
-
 Qatar
-
 Reunion
-
 Romania
-
 Rwanda
-
 Saudi Arabia
-
 Serbia
-
 Singapore
-
 Slovakia
-
 Slovenia
-
 Somalia
-
 South Africa
-
 Spain
-
 Sri Lanka
-
 Sweden
-
 Switzerland
-
 Syria
-
 Taiwan
-
 Tajikistan
-
 Tanzania
-
 Thailand
-
 Trinidad and Tobago
-
 Tunisia
-
 Turkey
-
 UAE
-
 Uganda
-
 Ukraine
-
 United Kingdom
-
United States
-
 Uruguay
-
 Uzbekistan
-
 Venezuela
-
 Vietnam
-
 Yemen
-
 Zambia
-
 Zimbabwe
- Forex
- Crypto












