

Chevron stock weekly forecast: Neutral performance persists as momentum indicators reach overbought territory

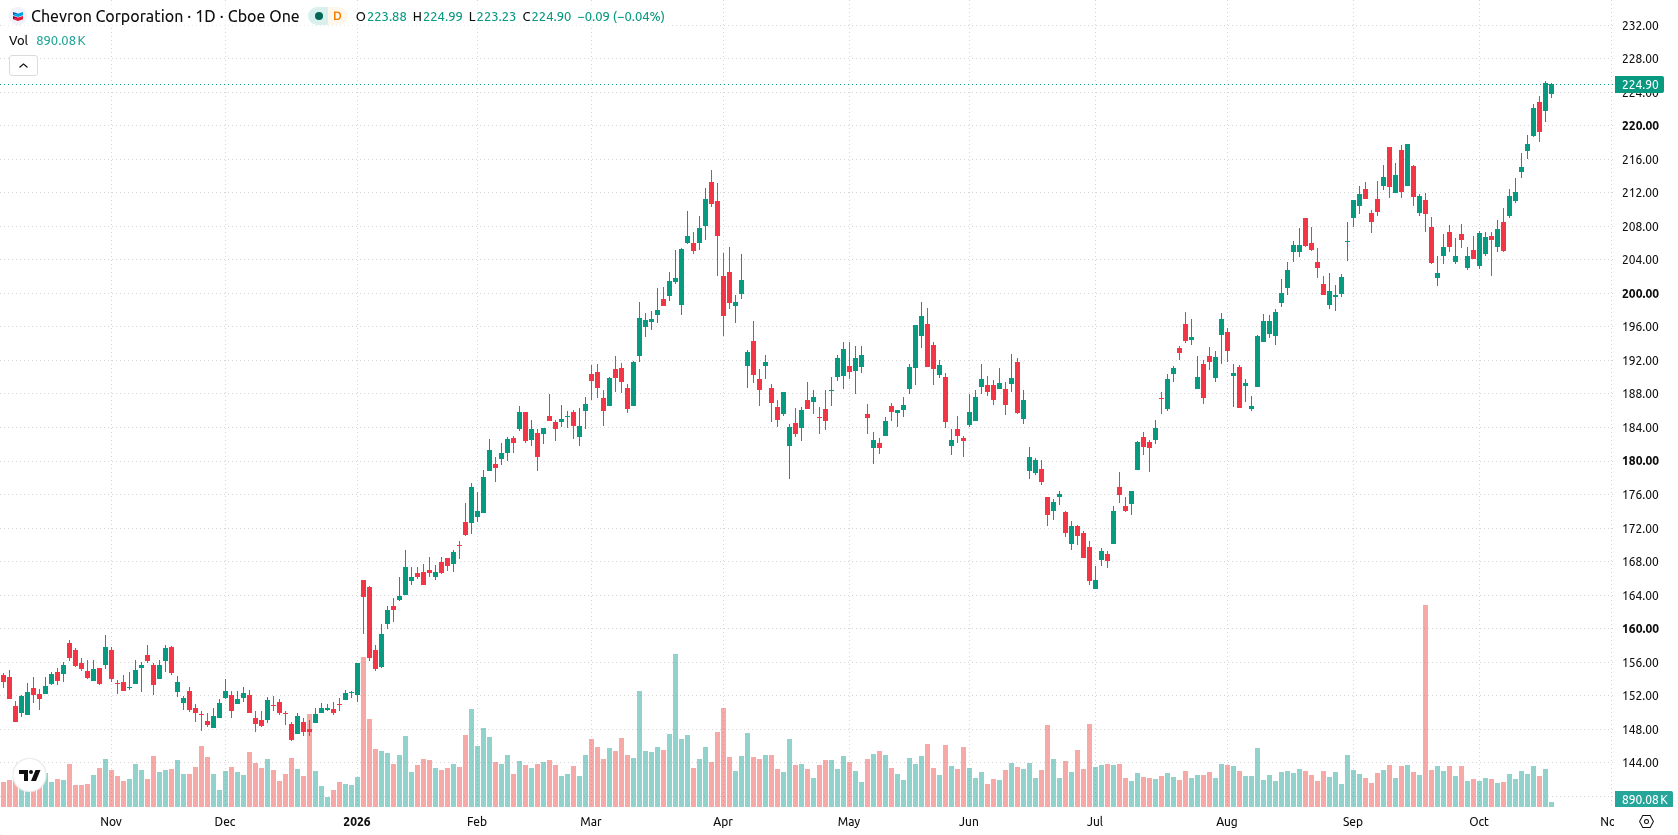
Shares of Chevron Corporation (CVX) are trading near $225 as a steady recovery holds into the new week. A neutral weekly performance leaves the setup looking stretched, with traders watching for signs of momentum exhaustion or a potential pause just below resistance.
 236.45
Highlights
- Shares of Chevron closed at $224.99, unchanged for the week and holding the top of the current range.
- Daily momentum indicators register as overbought, which suggests the recent advance may lose steam and a sideways move could emerge.
- Chevron shares are projected to fluctuate between $219.73 and $230.14 over the next five sessions, with immediate resistance at $225.29 and support at $213.76.
Institutional inflows and leadership changes highlight shifting sentiment this week
Chevron announced a reshuffle of senior roles, including a new Chief Financial Officer set to start in January 2027, and plans for affiliated directors to exit the Hess Midstream boards after the closing of a purchase agreement, according to Simply Wall St News. The company has also seen several institutional investors, such as Annex Advisory Services LLC and TD Waterhouse Canada Inc., increase their positions during the third quarter. Notably, Chevron generated $18.1 billion of free cash flow in the second quarter of 2026 as reported by Yahoo Finance.
Overbought signals intensify as volatility persists near resistance
On the daily chart, Chevron is pressing up against immediate resistance at $225.29 after a week of 5.39% volatility, while daily momentum signals point to an overbought backdrop. Both RSI at 70.84 and CCI at 175.26 register in overbought territory, suggesting the recent advance could soon run out of steam. The MACD remains firmly aligned in a buy direction, but the overall momentum character signals an emerging move sideways that is not yet confirmed. Immediate support is seen at $213.76, with the Ichimoku Kijun at $213.08 offering additional backing just below.
Consolidation likely ahead as breakout risk builds for the coming week
Over the next five trading days, Chevron shares are expected to fluctuate between $219.73 and $230.14. There is a very high probability (more than 80%) of an increase and a very low probability (less than 20%) of a decrease. The base case calls for ongoing consolidation beneath $225.29 resistance as the move matures. A clear breakout above $225.29 would set a path toward the upper boundary of the expected range, while a decisive drop below $213.76 support could signal a deeper retreat toward the lower end.
Previously it was reported that Chevron’s technical setup favored ongoing strength with consolidation preceding a potential upward breakout. With the current move now encountering overbought momentum and resistance at $225.29, traders should watch for a confirmed breakout or reversal to determine the next direction within the evolving volatility band.











-
 Afghanistan
-
 Albania
-
 Algeria
-
 Angola
-
 Argentina
-
 Armenia
-
 Australia
-
 Austria
-
 Azerbaijan
-
 Bahamas
-
 Bahrain
-
 Bangladesh
-
 Belarus
-
 Belgium
-
 Bolivia
-
 Botswana
-
 Brazil
-
 Brunei
-
 Bulgaria
-
 Cambodia
-
 Cameroon
-
 Canada
-
 Chile
-
 China
-
 Colombia
-
 Congo
-
 Costa Rica
-
 Cote d'Ivoire
-
 Croatia
-
 Cuba
-
 Cyprus
-
 Czechia
-
 DR Congo
-
 Denmark
-
 Dominican Republic
-
 Ecuador
-
 Egypt
-
 El Salvador
-
 Estonia
-
 Eswatini
-
 Ethiopia
-
 Finland
-
 France
-
 Georgia
-
 Germany
-
 Ghana
-
 Greece
-
 Haiti
-
 Hong Kong
-
 Hungary
-
 India
-
 Indonesia
-
 Iran, Islamic republic
-
 Iraq
-
 Ireland
-
 Israel
-
 Italy
-
 Jamaica
-
 Japan
-
 Jordan
-
 Kazakhstan
-
 Kenya
-
 Korea
-
 Kuwait
-
 Kyrgyzstan
-
 Laos
-
 Latvia
-
 Lebanon
-
 Lesotho
-
 Libya
-
 Lithuania
-
 Luxembourg
-
 Madagascar
-
 Malaysia
-
 Malta
-
 Mauritius
-
 Mexico
-
 Moldova
-
 Mongolia
-
 Montenegro
-
 Morocco
-
 Mozambique
-
 Myanmar
-
 Namibia
-
 Nepal
-
 Netherlands
-
 New Zealand
-
 Nigeria
-
 North Macedonia
-
 Norway
-
 Oman
-
 Pakistan
-
 Palestine
-
 Panama
-
 Papua New Guinea
-
 Paraguay
-
 Peru
-
 Philippines
-
 Poland
-
 Portugal
-
 Puerto Rico
-
 Qatar
-
 Reunion
-
 Romania
-
 Rwanda
-
 Saudi Arabia
-
 Serbia
-
 Singapore
-
 Slovakia
-
 Slovenia
-
 Somalia
-
 South Africa
-
 Spain
-
 Sri Lanka
-
 Sweden
-
 Switzerland
-
 Syria
-
 Taiwan
-
 Tajikistan
-
 Tanzania
-
 Thailand
-
 Trinidad and Tobago
-
 Tunisia
-
 Turkey
-
 UAE
-
 Uganda
-
 Ukraine
-
 United Kingdom
-
United States
-
 Uruguay
-
 Uzbekistan
-
 Venezuela
-
 Vietnam
-
 Yemen
-
 Zambia
-
 Zimbabwe
- Forex
- Crypto












