

PepsiCo shares trend higher as profit-taking risk rises near $133.06 resistance: weekly analysis

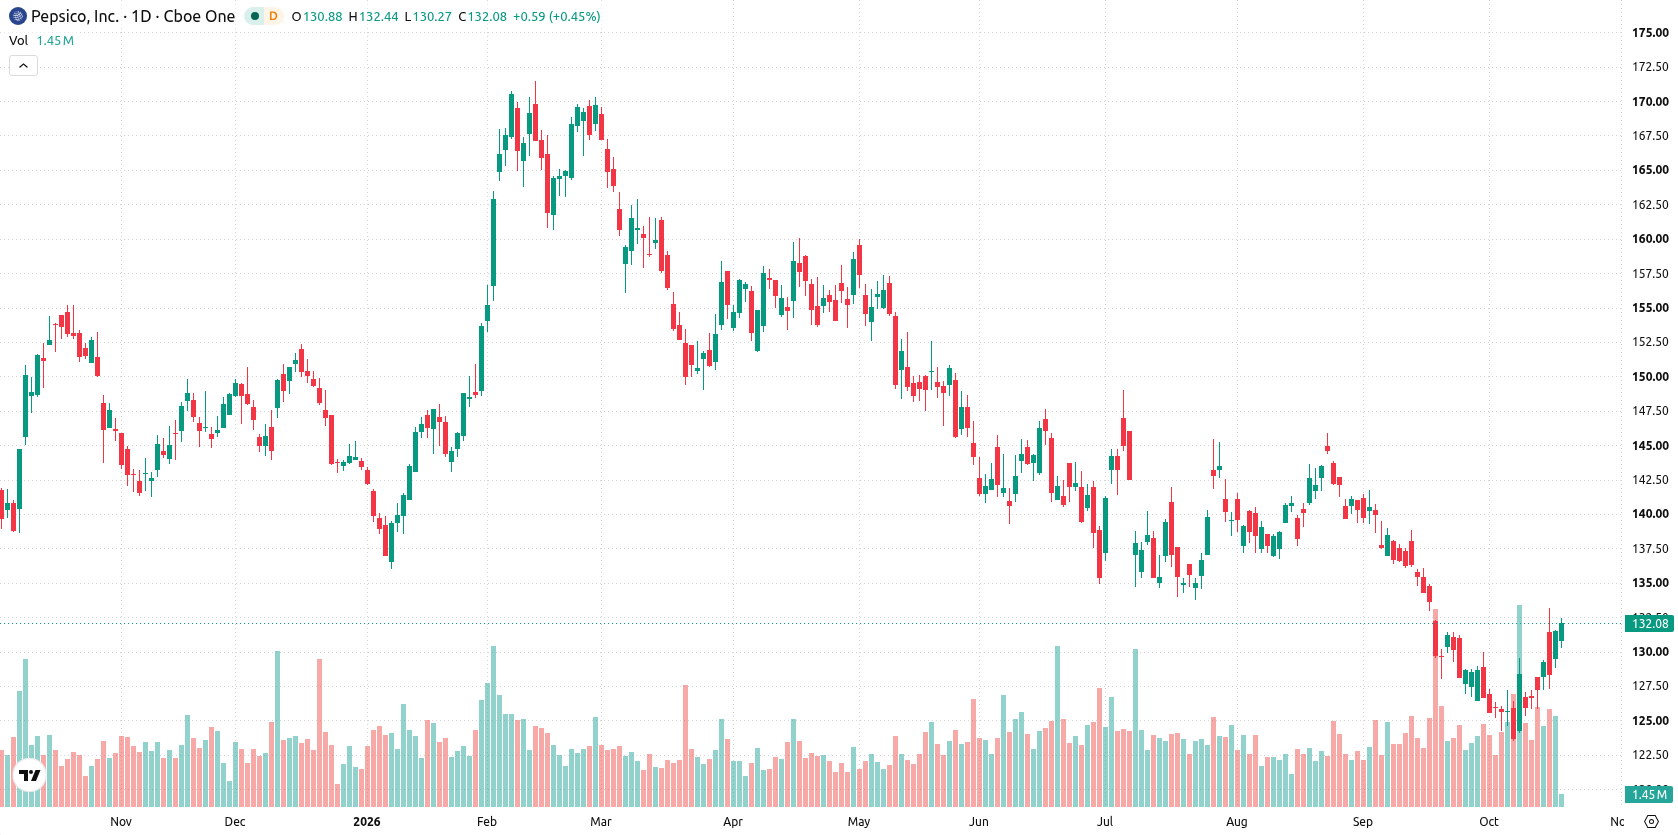
Shares of PepsiCo, Inc. (PEP) are trading near $132 as recovery efforts hold, but the technical setup looks increasingly stretched. The charts show a firm upward trend yet mixed momentum signals, leaving the stock exposed to a possible reversal if profit-taking emerges. Corporate developments and outlook changes are likely to shape next week’s action.
 131.56
133.06
Highlights
- Shares of PepsiCo rose to $132.16 over the past week, maintaining a position above short-term averages but below longer-term moving averages.
- Momentum indicators are mixed, with overbought signals and a strong sell bias on MACD suggesting limited upside and potential for reversal.
- The stock is expected to consolidate between $130.77 support and $133.06 resistance, with a predicted range of $128.95 to $135.35 next week.
Earnings cuts and lost KFC deal drive downside reassessment this week
PepsiCo cut its fiscal 2026 core EPS growth outlook to 2.5%-3.5% on October 8, down from prior guidance, citing rising input costs, according to Yahoo Finance. Zacks Research also lowered its FY2026 earnings per share estimate for the company (source: MarketBeat). After losing a major U.S. beverage partnership with KFC to Coca-Cola, PEP is now evaluating an expansion or acceleration of its refranchising strategy in the U.S., while continuing investments in supply chain sustainability initiatives (source: Yahoo Finance).
Overbought signals emerge as trend strength collides with MACD sell bias
On the daily chart, the setup features a sustained move higher with a firm trend, as evidenced by the price closing at the very top of its weekly range. However, momentum signals are mixed: CCI at 135.61 and Stochastic RSI at 100 both flag overbought conditions, while MACD shows a strong sell bias. Volatility remains notable at 5.67%. Nearest support is defined by the Ichimoku Kijun at $130.77, while the next resistance is at the weekly high of $133.06. This structure suggests upward momentum is in place but vulnerable to reversal if overbought conditions trigger profit-taking.
Directional bias favors consolidation as breakout hinges on support or resistance
Next week, the expected range for PepsiCo stock is $128.95 to $135.35, with a 43% probability of an increase and a 57% probability of a decrease. The base case sees price continuing to consolidate between $130.77 support and $133.06 resistance. A bullish scenario would require a push above $133.06, opening the way toward the upper end of the range. Conversely, a failure to hold $130.77 would increase the likelihood of a pullback toward $128.95 support.
Earlier, analysts noted that PepsiCo faced ongoing margin pressures and persistent downside risk, emphasizing technical weakness as a central concern. The current analysis adds a new dimension, as the stock now displays an extended upward move but faces a heightened risk of short-term reversal, making the $130.77 support level critical to monitor for signs of a pullback.





Latest PepsiCo News



-
 Afghanistan
-
 Albania
-
 Algeria
-
 Angola
-
 Argentina
-
 Armenia
-
 Australia
-
 Austria
-
 Azerbaijan
-
 Bahamas
-
 Bahrain
-
 Bangladesh
-
 Belarus
-
 Belgium
-
 Bolivia
-
 Botswana
-
 Brazil
-
 Brunei
-
 Bulgaria
-
 Cambodia
-
 Cameroon
-
 Canada
-
 Chile
-
 China
-
 Colombia
-
 Congo
-
 Costa Rica
-
 Cote d'Ivoire
-
 Croatia
-
 Cuba
-
 Cyprus
-
 Czechia
-
 DR Congo
-
 Denmark
-
 Dominican Republic
-
 Ecuador
-
 Egypt
-
 El Salvador
-
 Estonia
-
 Eswatini
-
 Ethiopia
-
 Finland
-
 France
-
 Georgia
-
 Germany
-
 Ghana
-
 Greece
-
 Haiti
-
 Hong Kong
-
 Hungary
-
 India
-
 Indonesia
-
 Iran, Islamic republic
-
 Iraq
-
 Ireland
-
 Israel
-
 Italy
-
 Jamaica
-
 Japan
-
 Jordan
-
 Kazakhstan
-
 Kenya
-
 Korea
-
 Kuwait
-
 Kyrgyzstan
-
 Laos
-
 Latvia
-
 Lebanon
-
 Lesotho
-
 Libya
-
 Lithuania
-
 Luxembourg
-
 Madagascar
-
 Malaysia
-
 Malta
-
 Mauritius
-
 Mexico
-
 Moldova
-
 Mongolia
-
 Montenegro
-
 Morocco
-
 Mozambique
-
 Myanmar
-
 Namibia
-
 Nepal
-
 Netherlands
-
 New Zealand
-
 Nigeria
-
 North Macedonia
-
 Norway
-
 Oman
-
 Pakistan
-
 Palestine
-
 Panama
-
 Papua New Guinea
-
 Paraguay
-
 Peru
-
 Philippines
-
 Poland
-
 Portugal
-
 Puerto Rico
-
 Qatar
-
 Reunion
-
 Romania
-
 Rwanda
-
 Saudi Arabia
-
 Serbia
-
 Singapore
-
 Slovakia
-
 Slovenia
-
 Somalia
-
 South Africa
-
 Spain
-
 Sri Lanka
-
 Sweden
-
 Switzerland
-
 Syria
-
 Taiwan
-
 Tajikistan
-
 Tanzania
-
 Thailand
-
 Trinidad and Tobago
-
 Tunisia
-
 Turkey
-
 UAE
-
 Uganda
-
 Ukraine
-
 United Kingdom
-
United States
-
 Uruguay
-
 Uzbekistan
-
 Venezuela
-
 Vietnam
-
 Yemen
-
 Zambia
-
 Zimbabwe
- Forex
- Crypto












