

Shell plc executes share buyback: Will SHEL remain range-bound after recent program news?

Shell (SHEL) stock is trading at GBX3,931 today, showing a modest slip with moderate volatility on the session. The price remains positioned above its key moving averages, reflecting ongoing support across short-, medium-, and long-term horizons.
 3734.50
Highlights
- Shell executed a share buyback for cancellation on October 16, 2026, reducing the outstanding share count under an approved program.
- This buyback supports per-share valuation metrics and signals management's approach to capital allocation amid ongoing broad market pressure.
- Shares of Shell currently trade around GBX3,931 with a projected 2 to 3 day price range of GBX3,857 to GBX4,004, with most technical indicators showing buyer dominance despite some overbought and mixed momentum signals.
Buyback-driven supply reduction amid continued selling pressure
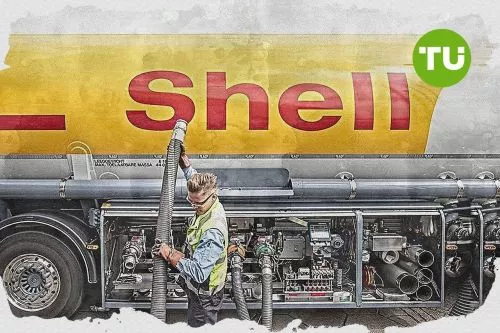
On October 16, 2026, Shell plc executed a share buyback, purchasing shares for cancellation as part of a previously approved program, according to Marketscreener. This reduction in outstanding shares mechanically supports per-share metrics and may signal prudent capital allocation by management. Such actions often provide a constructive backdrop for valuation, though price action has remained under broader selling pressure.
Mixed momentum as buyers control above support levels
Technical analysis indicates the price currently trades above the MA-20 and MA-50 on the hourly chart, and remains well above the MA-200 on the daily timeframe. The Ichimoku Kijun level at GBX3,927 serves as immediate support. Momentum signals are mixed: MACD indicates a strong buy and ADX shows buyers in control, while RSI registers 54.68 (Buy) and Stochastic RSI is oversold. The Commodity Channel Index is neutral, Bull/Bear Power is in overbought territory confirming buyer dominance intraday, and the Awesome Oscillator is neutral.
Range-bound outlook with potential for breakout risk
Over the next two to three trading days, the price is expected to fluctuate between GBX3,857 and GBX4,004, with a 67% likelihood of further upside within this range. The baseline scenario is sideways movement, while a bullish scenario would see a breakout above resistance, pushing the price to the top of the projected band. Conversely, a bearish scenario would involve a drop below support, targeting the lower boundary near GBX3,857.
Earlier, analysts noted that rising energy prices and a focus on disciplined spending had driven strong earnings and boosted buyback activity among major oil companies like Shell. This latest technical update adds a new dimension by highlighting immediate price levels to watch, with the GBX3,927 Ichimoku Kijun line serving as a key support point for traders monitoring potential breakout or breakdown scenarios.









-
 Afghanistan
-
 Albania
-
 Algeria
-
 Angola
-
 Argentina
-
 Armenia
-
 Australia
-
 Austria
-
 Azerbaijan
-
 Bahamas
-
 Bahrain
-
 Bangladesh
-
 Belarus
-
 Belgium
-
 Bolivia
-
 Botswana
-
 Brazil
-
 Brunei
-
 Bulgaria
-
 Cambodia
-
 Cameroon
-
 Canada
-
 Chile
-
 China
-
 Colombia
-
 Congo
-
 Costa Rica
-
 Cote d'Ivoire
-
 Croatia
-
 Cuba
-
 Cyprus
-
 Czechia
-
 DR Congo
-
 Denmark
-
 Dominican Republic
-
 Ecuador
-
 Egypt
-
 El Salvador
-
 Estonia
-
 Eswatini
-
 Ethiopia
-
 Finland
-
 France
-
 Georgia
-
 Germany
-
 Ghana
-
 Greece
-
 Haiti
-
 Hong Kong
-
 Hungary
-
 India
-
 Indonesia
-
 Iran, Islamic republic
-
 Iraq
-
 Ireland
-
 Israel
-
 Italy
-
 Jamaica
-
 Japan
-
 Jordan
-
 Kazakhstan
-
 Kenya
-
 Korea
-
 Kuwait
-
 Kyrgyzstan
-
 Laos
-
 Latvia
-
 Lebanon
-
 Lesotho
-
 Libya
-
 Lithuania
-
 Luxembourg
-
 Madagascar
-
 Malaysia
-
 Malta
-
 Mauritius
-
 Mexico
-
 Moldova
-
 Mongolia
-
 Montenegro
-
 Morocco
-
 Mozambique
-
 Myanmar
-
 Namibia
-
 Nepal
-
 Netherlands
-
 New Zealand
-
 Nigeria
-
 North Macedonia
-
 Norway
-
 Oman
-
 Pakistan
-
 Palestine
-
 Panama
-
 Papua New Guinea
-
 Paraguay
-
 Peru
-
 Philippines
-
 Poland
-
 Portugal
-
 Puerto Rico
-
 Qatar
-
 Reunion
-
 Romania
-
 Rwanda
-
 Saudi Arabia
-
 Serbia
-
 Singapore
-
 Slovakia
-
 Slovenia
-
 Somalia
-
 South Africa
-
 Spain
-
 Sri Lanka
-
 Sweden
-
 Switzerland
-
 Syria
-
 Taiwan
-
 Tajikistan
-
 Tanzania
-
 Thailand
-
 Trinidad and Tobago
-
 Tunisia
-
 Turkey
-
 UAE
-
 Uganda
-
 Ukraine
-
 United Kingdom
-
United States
-
 Uruguay
-
 Uzbekistan
-
 Venezuela
-
 Vietnam
-
 Yemen
-
 Zambia
-
 Zimbabwe
- Forex
- Crypto












