

Reckitt Benckiser stock consolidates near GBX5,492 while buyers provide support despite mixed momentum signals

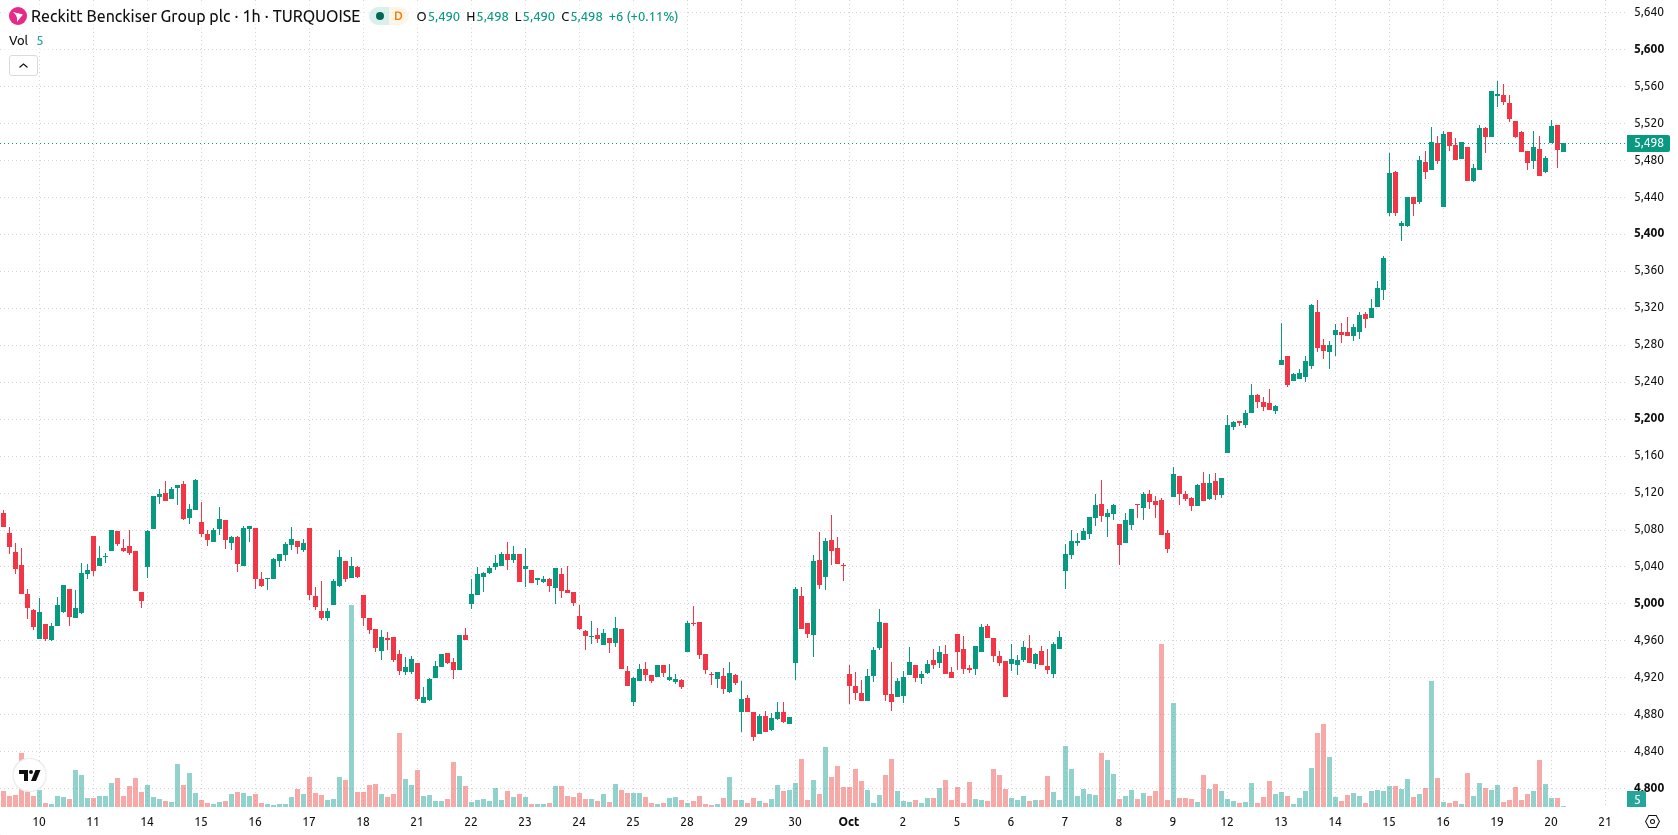
Reckitt Benckiser (RKT) stock is trading at GBX5,492 after a modest gain on the session. The price remains between its main short- and medium-term moving averages, reflecting a period of limited direction amid mixed signals.
 5716.00
5728.00
Highlights
- RKT/GBX stock trades below its short-term moving average but remains above medium and long-term technical support levels.
- Momentum signals are mixed with strong buy indicators offset by overbought and oversold technical cues and intraday seller pressure.
- Expected trading range for the next 2 to 3 days is GBX5,358 to GBX5,625 with a 71% probability of an upward move.
Mixed signals as support holds but intraday weakness persists
On the hourly chart, RKT is trading below the MA-20 at GBX5,501 but above the MA-50 at GBX5,400. On the daily timeframe, the price holds above the MA-200 at GBX5,253. The Ichimoku Kijun at GBX5,488 provides immediate support. Momentum indicators paint a mixed picture: MACD and ADX both point to buy momentum, while Stoch RSI is oversold and RSI at 52.15 shows a marginal upward tilt. CCI is neutral, and intraday Bull/Bear Power signals buyers' dominance despite subdued volatility. The daily close at GBX5,492 leaves the price near the session low, indicating intraday weakness even as some broader momentum measures remain strong.
Range-bound outlook as bullish probabilities exceed downside risk
Over the next two to three trading days, RKT is likely to trade within a volatility band between GBX5,358 and GBX5,625. Current probabilities suggest a 71% chance of an upward move, with the baseline scenario being continued price fluctuation inside the established range. An upside scenario could see prices move above near-term resistance, while a bearish case would materialize if support at the Ichimoku Kijun or MA-50 gives way.
Earlier, analysts noted that Reckitt Benckiser stock was maintaining a bullish bias supported by ongoing technical strength and resilient price action. The current analysis adds nuance by highlighting mixed short-term signals within a defined volatility band, with traders advised to closely monitor the MA-50 and Ichimoku Kijun as pivots for potential breakout or breakdown scenarios.












-
 Afghanistan
-
 Albania
-
 Algeria
-
 Angola
-
 Argentina
-
 Armenia
-
 Australia
-
 Austria
-
 Azerbaijan
-
 Bahamas
-
 Bahrain
-
 Bangladesh
-
 Belarus
-
 Belgium
-
 Bolivia
-
 Botswana
-
 Brazil
-
 Brunei
-
 Bulgaria
-
 Cambodia
-
 Cameroon
-
 Canada
-
 Chile
-
 China
-
 Colombia
-
 Congo
-
 Costa Rica
-
 Cote d'Ivoire
-
 Croatia
-
 Cuba
-
 Cyprus
-
 Czechia
-
 DR Congo
-
 Denmark
-
 Dominican Republic
-
 Ecuador
-
 Egypt
-
 El Salvador
-
 Estonia
-
 Eswatini
-
 Ethiopia
-
 Finland
-
 France
-
 Georgia
-
 Germany
-
 Ghana
-
 Greece
-
 Haiti
-
 Hong Kong
-
 Hungary
-
 India
-
 Indonesia
-
 Iran, Islamic republic
-
 Iraq
-
 Ireland
-
 Israel
-
 Italy
-
 Jamaica
-
 Japan
-
 Jordan
-
 Kazakhstan
-
 Kenya
-
 Korea
-
 Kuwait
-
 Kyrgyzstan
-
 Laos
-
 Latvia
-
 Lebanon
-
 Lesotho
-
 Libya
-
 Lithuania
-
 Luxembourg
-
 Madagascar
-
 Malaysia
-
 Malta
-
 Mauritius
-
 Mexico
-
 Moldova
-
 Mongolia
-
 Montenegro
-
 Morocco
-
 Mozambique
-
 Myanmar
-
 Namibia
-
 Nepal
-
 Netherlands
-
 New Zealand
-
 Nigeria
-
 North Macedonia
-
 Norway
-
 Oman
-
 Pakistan
-
 Palestine
-
 Panama
-
 Papua New Guinea
-
 Paraguay
-
 Peru
-
 Philippines
-
 Poland
-
 Portugal
-
 Puerto Rico
-
 Qatar
-
 Reunion
-
 Romania
-
 Rwanda
-
 Saudi Arabia
-
 Serbia
-
 Singapore
-
 Slovakia
-
 Slovenia
-
 Somalia
-
 South Africa
-
 Spain
-
 Sri Lanka
-
 Sweden
-
 Switzerland
-
 Syria
-
 Taiwan
-
 Tajikistan
-
 Tanzania
-
 Thailand
-
 Trinidad and Tobago
-
 Tunisia
-
 Turkey
-
 UAE
-
 Uganda
-
 Ukraine
-
 United Kingdom
-
United States
-
 Uruguay
-
 Uzbekistan
-
 Venezuela
-
 Vietnam
-
 Yemen
-
 Zambia
-
 Zimbabwe
- Forex
- Crypto












