

Alphabet stock struggles to break past MA-50 barrier with volatility contained: weekly analysis

Shares of Alphabet Inc. (GOOGL) are trading near $344 after a rise of just over 1% last week, as a recent decline has pushed the stock into oversold territory. The chart shows mixed momentum, with support holding but limited signs of sustained buying strength. Heading into the coming week, the setup points to hesitation as the market weighs headline risks and technical barriers.
 283.13
326.23
Highlights
- Shares of Alphabet rose 1.02% over the past week to $344.2, currently consolidating between short-term averages.
- Technical indicators are mixed, with neutral momentum signals and some oversold pressure, while long-term trend remains bullish.
- Trading is likely to remain in a $335.25 to $353.14 range, with immediate support at $341.05 and resistance at $344.46.
Investor retreat accelerates as legal action and AI investments drive caution
Alphabet faces a securities class action lawsuit over alleged investor misstatements, with cases filed recently in the United States District Court for the Northern District of California according to PR Newswire. On October 13, 2026, Google expanded access to its Gemini 4 Argon AI model for developers and select users, a step Reuters noted aims to bolster its AI position after delays at DeepMind. ETFs also turned net sellers of GOOGL on October 15, as MarketBeat reported, while institutional investors trimmed stakes in the company. High capital expenditures and continued investment in AI and cloud remain key themes as the week begins.
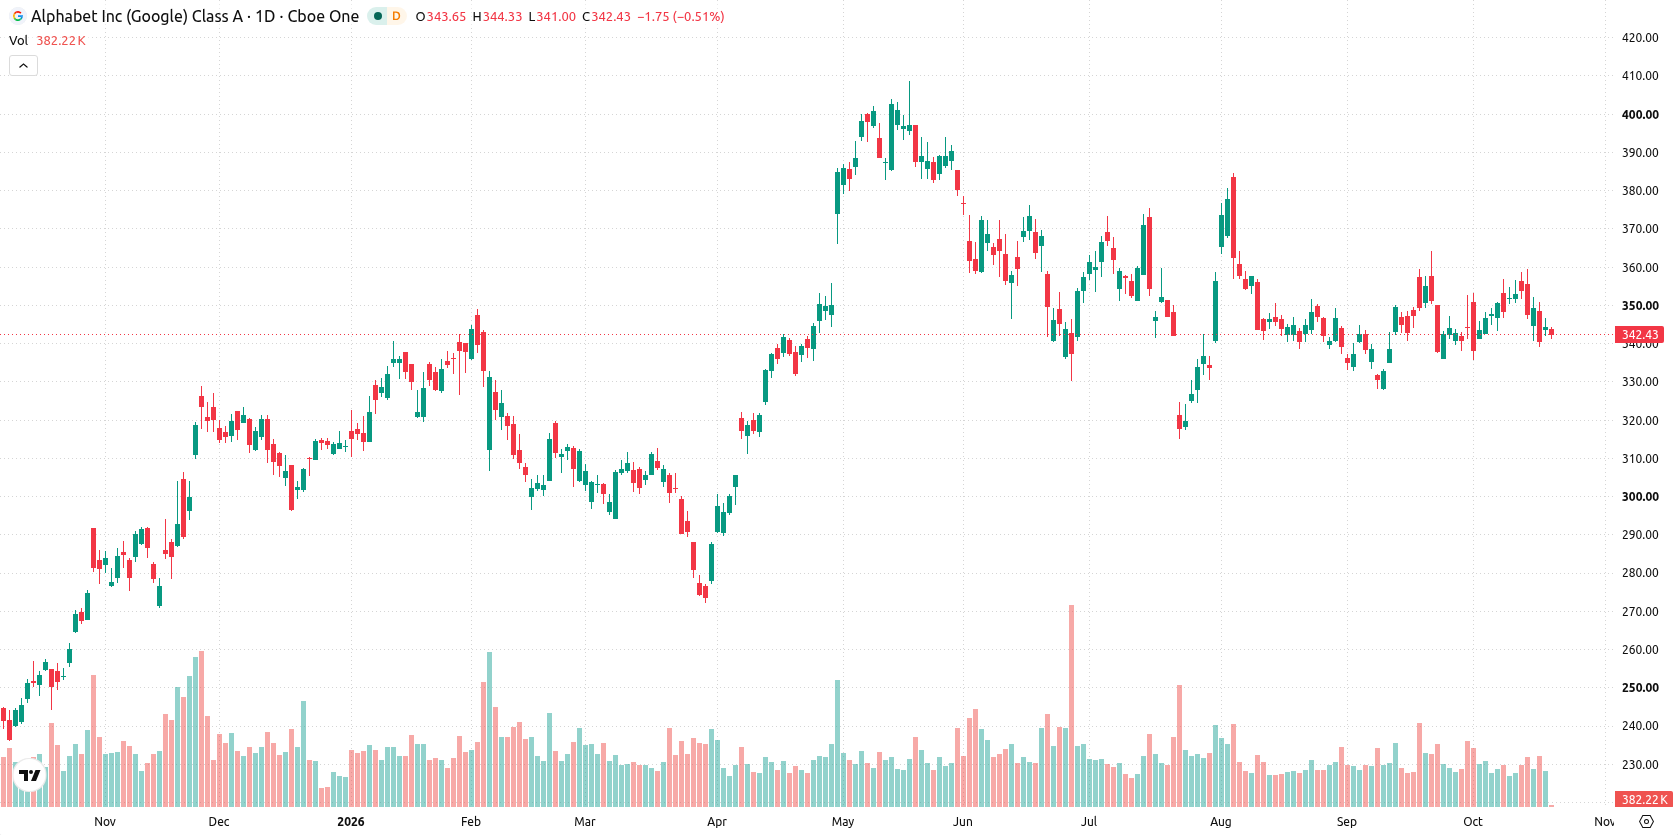
Hesitation near resistance this week as mixed indicators stall trend emergence
The daily chart signals a contained move within a narrow range, with volatility for the week measured at 5.9%. Momentum is mixed: the RSI holds at 48.26 in the neutral zone, while Bull/Bear Power reads -0.38, suggesting oversold pressure is present despite the MACD signaling strong buy momentum. Immediate support is marked by the MA-200 at $341.05, while resistance is reinforced at the MA-50, currently at $344.46, and further capped by the Ichimoku Kijun at $349.6. This configuration hints at hesitation near resistance with no clear trend dominating the next few sessions.
Consolidation likely next week as upside capped barring a breakout
Over the coming trading week, the expected range is $335.25 to $353.14, with a 33% probability of an increase and a 67% probability of a decrease. The base case favors continued consolidation between $341.05 support and $344.46 resistance. A break above $344.46 and especially through $349.6 could open a move toward the range top. Conversely, a drop below $341.05 would expose the stock to downside risk closer to the $335.25 area.
Earlier, analysts noted that Alphabet shares were consolidating within a defined volatility band as traders awaited both earnings and shifts in institutional positioning. The current context introduces new legal headwinds and developments in AI, underscoring the importance of closely monitoring the $341.05 support and $344.46 resistance as potential inflection points for near-term price action.











-
 Afghanistan
-
 Albania
-
 Algeria
-
 Angola
-
 Argentina
-
 Armenia
-
 Australia
-
 Austria
-
 Azerbaijan
-
 Bahamas
-
 Bahrain
-
 Bangladesh
-
 Belarus
-
 Belgium
-
 Bolivia
-
 Botswana
-
 Brazil
-
 Brunei
-
 Bulgaria
-
 Cambodia
-
 Cameroon
-
 Canada
-
 Chile
-
 China
-
 Colombia
-
 Congo
-
 Costa Rica
-
 Cote d'Ivoire
-
 Croatia
-
 Cuba
-
 Cyprus
-
 Czechia
-
 DR Congo
-
 Denmark
-
 Dominican Republic
-
 Ecuador
-
 Egypt
-
 El Salvador
-
 Estonia
-
 Eswatini
-
 Ethiopia
-
 Finland
-
 France
-
 Georgia
-
 Germany
-
 Ghana
-
 Greece
-
 Haiti
-
 Hong Kong
-
 Hungary
-
 India
-
 Indonesia
-
 Iran, Islamic republic
-
 Iraq
-
 Ireland
-
 Israel
-
 Italy
-
 Jamaica
-
 Japan
-
 Jordan
-
 Kazakhstan
-
 Kenya
-
 Korea
-
 Kuwait
-
 Kyrgyzstan
-
 Laos
-
 Latvia
-
 Lebanon
-
 Lesotho
-
 Libya
-
 Lithuania
-
 Luxembourg
-
 Madagascar
-
 Malaysia
-
 Malta
-
 Mauritius
-
 Mexico
-
 Moldova
-
 Mongolia
-
 Montenegro
-
 Morocco
-
 Mozambique
-
 Myanmar
-
 Namibia
-
 Nepal
-
 Netherlands
-
 New Zealand
-
 Nigeria
-
 North Macedonia
-
 Norway
-
 Oman
-
 Pakistan
-
 Palestine
-
 Panama
-
 Papua New Guinea
-
 Paraguay
-
 Peru
-
 Philippines
-
 Poland
-
 Portugal
-
 Puerto Rico
-
 Qatar
-
 Reunion
-
 Romania
-
 Rwanda
-
 Saudi Arabia
-
 Serbia
-
 Singapore
-
 Slovakia
-
 Slovenia
-
 Somalia
-
 South Africa
-
 Spain
-
 Sri Lanka
-
 Sweden
-
 Switzerland
-
 Syria
-
 Taiwan
-
 Tajikistan
-
 Tanzania
-
 Thailand
-
 Trinidad and Tobago
-
 Tunisia
-
 Turkey
-
 UAE
-
 Uganda
-
 Ukraine
-
 United Kingdom
-
United States
-
 Uruguay
-
 Uzbekistan
-
 Venezuela
-
 Vietnam
-
 Yemen
-
 Zambia
-
 Zimbabwe
- Forex
- Crypto












