

Will AAL extend its rally amid overbought signals and heightened volatility?

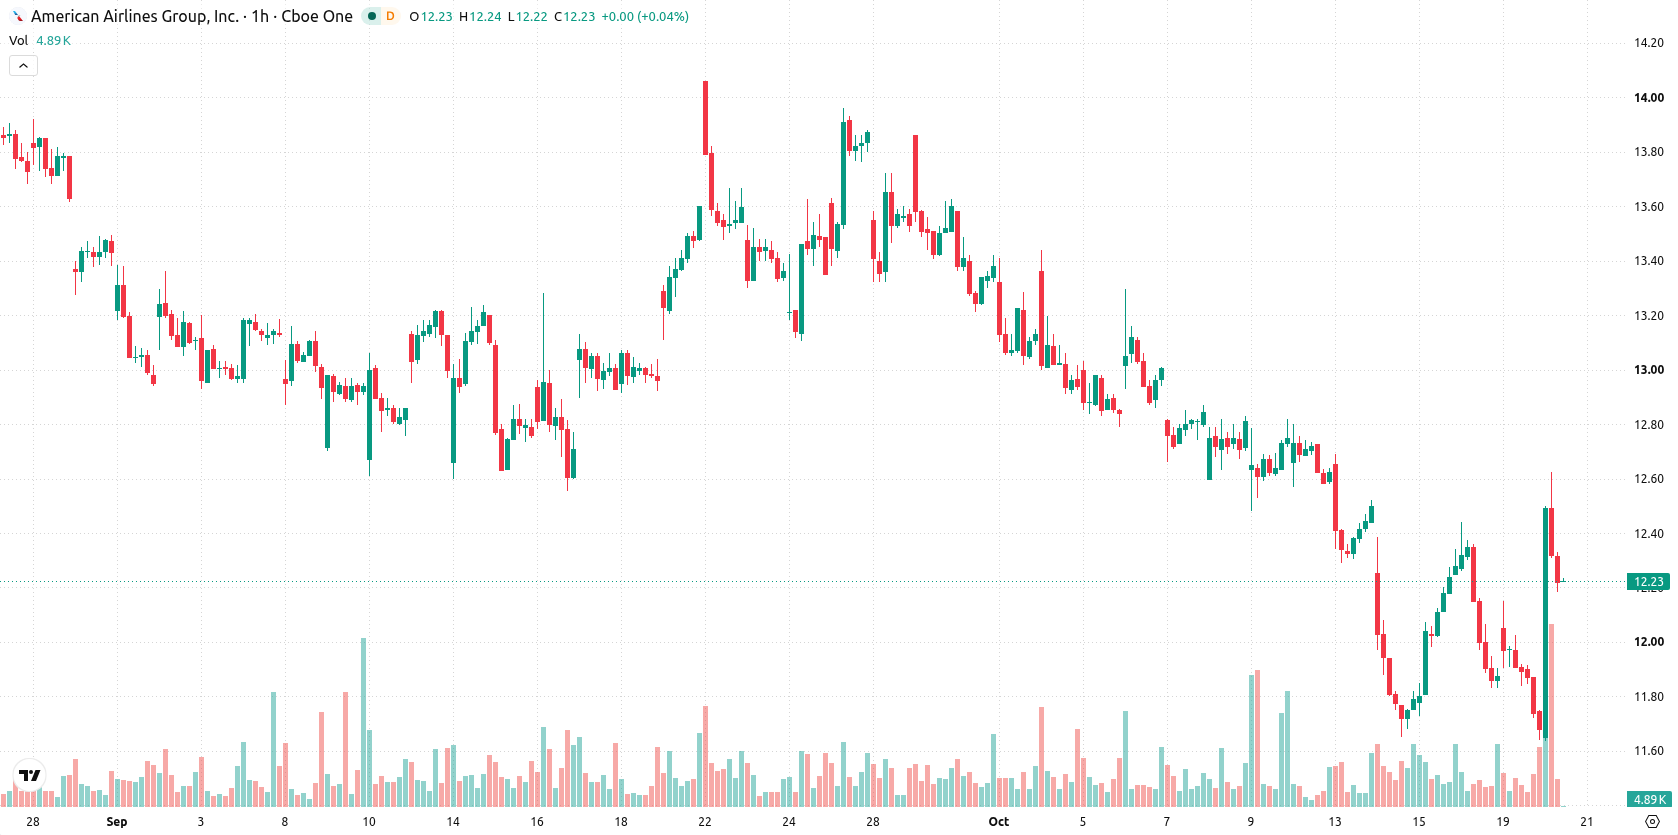
American Airlines (AAL) stock is trading at $12.22 after moving up 4.62% over the last session. The price is positioned above its key short-term averages while still below longer-term trend levels.
 13.56
14.33
Highlights
- AAL/USD stock recently posted a sharp daily move to $12.22, an increase of 4.62% on high volatility.
- Short-term technical indicators show mixed momentum with overbought signals, strong buyer influence intraday, but longer-term bearish trends persist.
- Over the next few days, price is expected to move within a $11.47 to $12.58 range, with slightly higher odds of a decline.
Mixed momentum with intraday buyer dominance and overbought signals
On the technical front, AAL/USD is currently above the MA-20 but just below the MA-50 on the hourly chart, and remains well under the MA-200 on the daily timeframe. The Ichimoku Kijun sits at $12.13 and now serves as immediate support. Momentum readings are mixed: RSI is at 57.63 (Buy), ADX indicates ongoing upward strength, while MACD is on Strong Sell. Both Stoch RSI and CCI are signaling an overbought condition. Bull/Bear Power shows buyers are dominant intraday, but the Awesome Oscillator is neutral with no clear direction. Volatility remains elevated with price sitting mid-range after a sharp move.
Downside risk outweighs amid expected rangebound trading
In the short term, AAL stock is likely to trade within a $11.47–$12.58 corridor, reflecting typical volatility for current conditions. The baseline scenario favors sideways movement. There is a slightly higher probability (52%) of a downturn, while a 48% chance exists for further advance. A bullish break above resistance could open room for a move to higher levels, while sustained trading below $12.13 may expose the $11.47 region as the next key support.
Previously it was reported that U.S. airlines, including American Airlines, are shifting their loyalty programs to prioritize customer spending over frequent flying, fundamentally changing how elite status is earned and valued. In light of ongoing market volatility and mixed technical readings, traders should closely monitor the $12.13 support and $12.58 resistance levels for signs of a potential breakout or renewed downward pressure in AAL shares.











-
 Afghanistan
-
 Albania
-
 Algeria
-
 Angola
-
 Argentina
-
 Armenia
-
 Australia
-
 Austria
-
 Azerbaijan
-
 Bahamas
-
 Bahrain
-
 Bangladesh
-
 Belarus
-
 Belgium
-
 Bolivia
-
 Botswana
-
 Brazil
-
 Brunei
-
 Bulgaria
-
 Cambodia
-
 Cameroon
-
 Canada
-
 Chile
-
 China
-
 Colombia
-
 Congo
-
 Costa Rica
-
 Cote d'Ivoire
-
 Croatia
-
 Cuba
-
 Cyprus
-
 Czechia
-
 DR Congo
-
 Denmark
-
 Dominican Republic
-
 Ecuador
-
 Egypt
-
 El Salvador
-
 Estonia
-
 Eswatini
-
 Ethiopia
-
 Finland
-
 France
-
 Georgia
-
 Germany
-
 Ghana
-
 Greece
-
 Haiti
-
 Hong Kong
-
 Hungary
-
 India
-
 Indonesia
-
 Iran, Islamic republic
-
 Iraq
-
 Ireland
-
 Israel
-
 Italy
-
 Jamaica
-
 Japan
-
 Jordan
-
 Kazakhstan
-
 Kenya
-
 Korea
-
 Kuwait
-
 Kyrgyzstan
-
 Laos
-
 Latvia
-
 Lebanon
-
 Lesotho
-
 Libya
-
 Lithuania
-
 Luxembourg
-
 Madagascar
-
 Malaysia
-
 Malta
-
 Mauritius
-
 Mexico
-
 Moldova
-
 Mongolia
-
 Montenegro
-
 Morocco
-
 Mozambique
-
 Myanmar
-
 Namibia
-
 Nepal
-
 Netherlands
-
 New Zealand
-
 Nigeria
-
 North Macedonia
-
 Norway
-
 Oman
-
 Pakistan
-
 Palestine
-
 Panama
-
 Papua New Guinea
-
 Paraguay
-
 Peru
-
 Philippines
-
 Poland
-
 Portugal
-
 Puerto Rico
-
 Qatar
-
 Reunion
-
 Romania
-
 Rwanda
-
 Saudi Arabia
-
 Serbia
-
 Singapore
-
 Slovakia
-
 Slovenia
-
 Somalia
-
 South Africa
-
 Spain
-
 Sri Lanka
-
 Sweden
-
 Switzerland
-
 Syria
-
 Taiwan
-
 Tajikistan
-
 Tanzania
-
 Thailand
-
 Trinidad and Tobago
-
 Tunisia
-
 Turkey
-
 UAE
-
 Uganda
-
 Ukraine
-
 United Kingdom
-
United States
-
 Uruguay
-
 Uzbekistan
-
 Venezuela
-
 Vietnam
-
 Yemen
-
 Zambia
-
 Zimbabwe
- Forex
- Crypto












