

LBTYA climbs over 5% after technical buyers step in during oversold trading

Liberty Global plc (LBTYA) jumped 5.00% as buyers stepped in to drive a technical rebound amid deeply oversold trading conditions and the absence of fresh corporate catalysts. The recovery is contradicted by the fact that the stock remains below all major moving averages, reinforcing a persistent bearish backdrop.
 10.85
10.85
Highlights
- Liberty Global stock trades below its 20-, 50-, and 200-day moving averages, affirming a persistent downward trend.
- All major momentum indicators show deep oversold and negative signals, with sellers dominating across timeframes.
- Expected five-day price range is $7.33 to $8.42, with over 80% probability of continued downside unless $7.97 resistance is broken.
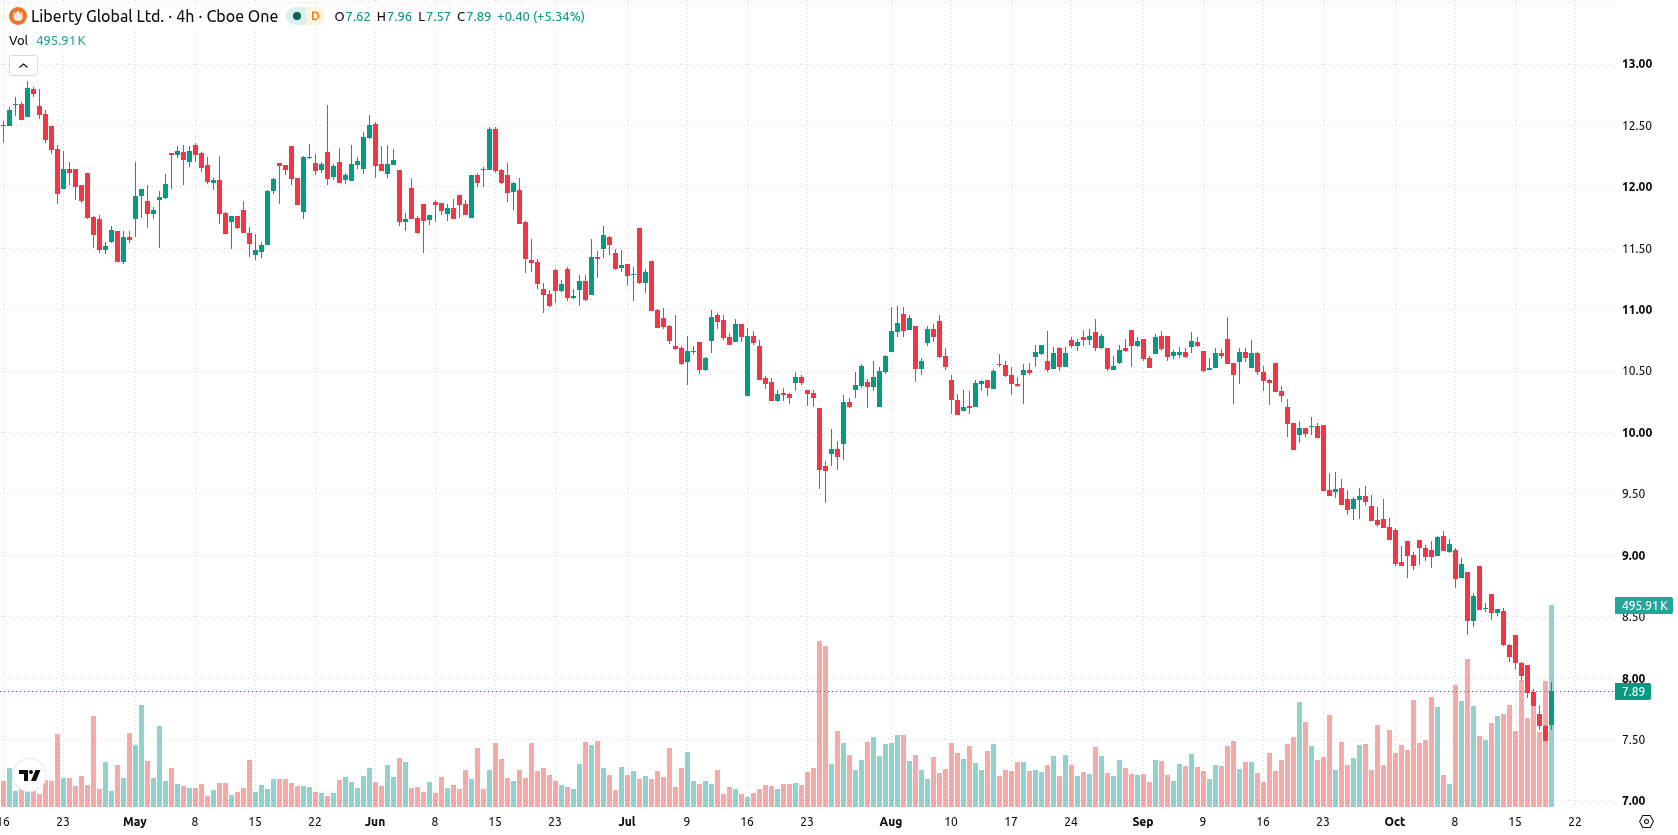
Bearish momentum persists as stock trades below key averages
Liberty Global is trading below its 20-, 50-, and 200-day moving averages ($8.87, $9.85, and $11.15 respectively), showing ongoing pressure from sellers across all timeframes. The near-term resistance stands at $7.97, and immediate support is marked at $7.57. The broader trend remains bearish, highlighted by the negative alignment of the 50- and 200-day averages. All major momentum indicators, including MACD, ADX, RSI (13.05), Stochastic RSI, CCI, BBP, and the Awesome Oscillator, point to strong negative momentum and oversold conditions, confirming that sellers remain in control.
Earlier, analysts noted that Liberty Global was under sustained selling pressure with a broadly bearish technical outlook. The current rebound has not meaningfully altered the negative trend, and risk remains skewed to the downside with the $7.57 support level as a critical threshold to monitor.










-
 Afghanistan
-
 Albania
-
 Algeria
-
 Angola
-
 Argentina
-
 Armenia
-
 Australia
-
 Austria
-
 Azerbaijan
-
 Bahamas
-
 Bahrain
-
 Bangladesh
-
 Belarus
-
 Belgium
-
 Bolivia
-
 Botswana
-
 Brazil
-
 Brunei
-
 Bulgaria
-
 Cambodia
-
 Cameroon
-
 Canada
-
 Chile
-
 China
-
 Colombia
-
 Congo
-
 Costa Rica
-
 Cote d'Ivoire
-
 Croatia
-
 Cuba
-
 Cyprus
-
 Czechia
-
 DR Congo
-
 Denmark
-
 Dominican Republic
-
 Ecuador
-
 Egypt
-
 El Salvador
-
 Estonia
-
 Eswatini
-
 Ethiopia
-
 Finland
-
 France
-
 Georgia
-
 Germany
-
 Ghana
-
 Greece
-
 Haiti
-
 Hong Kong
-
 Hungary
-
 India
-
 Indonesia
-
 Iran, Islamic republic
-
 Iraq
-
 Ireland
-
 Israel
-
 Italy
-
 Jamaica
-
 Japan
-
 Jordan
-
 Kazakhstan
-
 Kenya
-
 Korea
-
 Kuwait
-
 Kyrgyzstan
-
 Laos
-
 Latvia
-
 Lebanon
-
 Lesotho
-
 Libya
-
 Lithuania
-
 Luxembourg
-
 Madagascar
-
 Malaysia
-
 Malta
-
 Mauritius
-
 Mexico
-
 Moldova
-
 Mongolia
-
 Montenegro
-
 Morocco
-
 Mozambique
-
 Myanmar
-
 Namibia
-
 Nepal
-
 Netherlands
-
 New Zealand
-
 Nigeria
-
 North Macedonia
-
 Norway
-
 Oman
-
 Pakistan
-
 Palestine
-
 Panama
-
 Papua New Guinea
-
 Paraguay
-
 Peru
-
 Philippines
-
 Poland
-
 Portugal
-
 Puerto Rico
-
 Qatar
-
 Reunion
-
 Romania
-
 Rwanda
-
 Saudi Arabia
-
 Serbia
-
 Singapore
-
 Slovakia
-
 Slovenia
-
 Somalia
-
 South Africa
-
 Spain
-
 Sri Lanka
-
 Sweden
-
 Switzerland
-
 Syria
-
 Taiwan
-
 Tajikistan
-
 Tanzania
-
 Thailand
-
 Trinidad and Tobago
-
 Tunisia
-
 Turkey
-
 UAE
-
 Uganda
-
 Ukraine
-
 United Kingdom
-
United States
-
 Uruguay
-
 Uzbekistan
-
 Venezuela
-
 Vietnam
-
 Yemen
-
 Zambia
-
 Zimbabwe
- Forex
- Crypto












