

Microsoft stock weekly forecast: Extends recovery but faces overbought risk

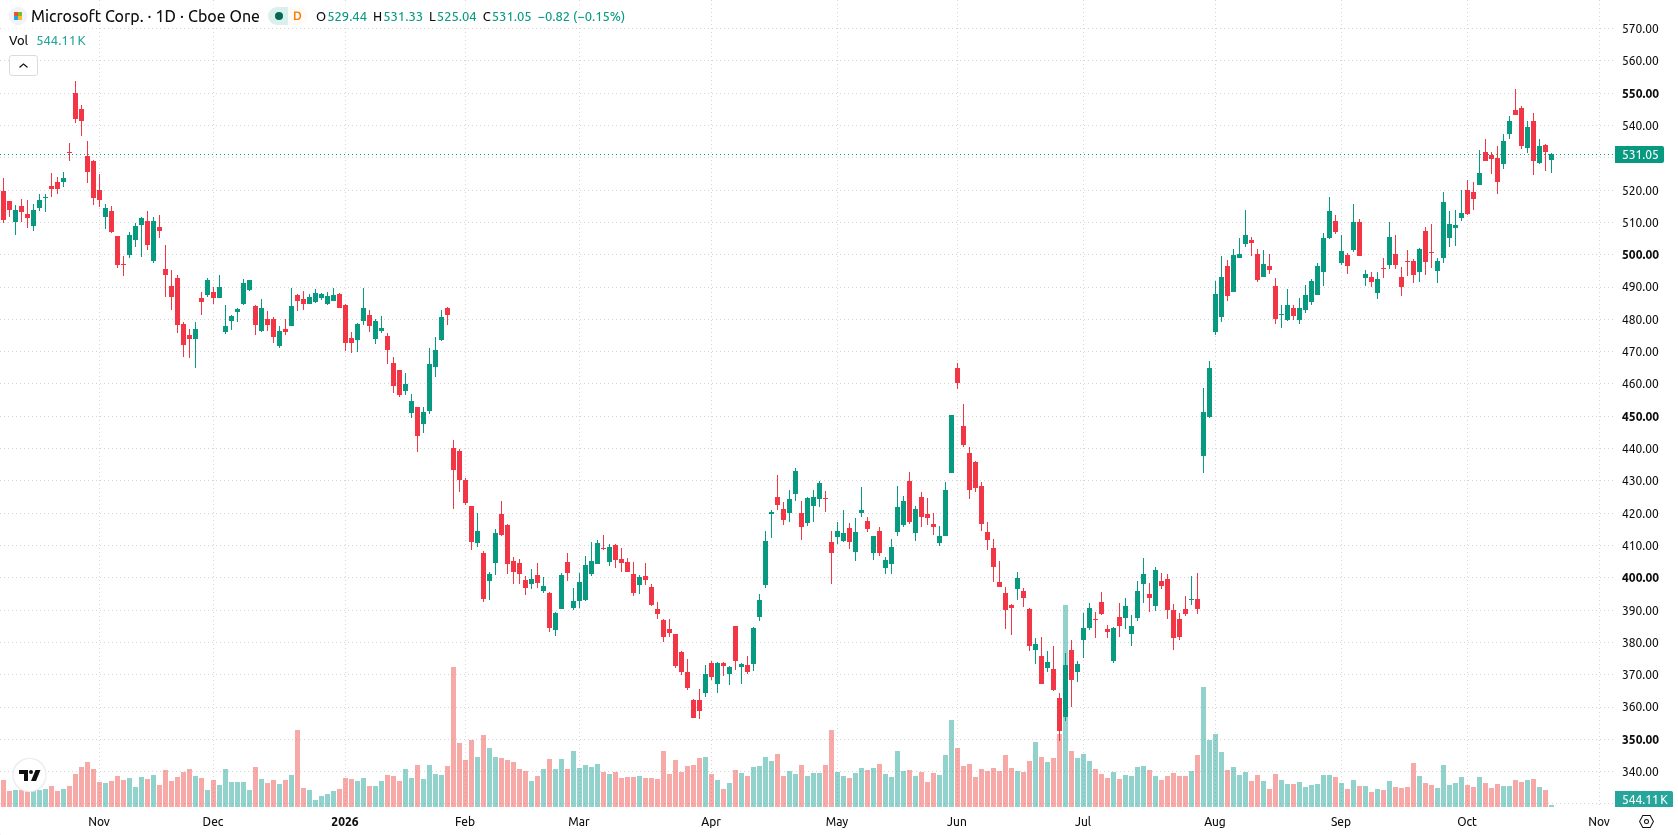
Shares of Microsoft Corporation (MSFT) are trading near $532, with the recovery setup extending for another week even as technical signals point to possible overbought conditions. The focus for the coming days is whether this upside momentum can continue, given the underlying trend and mounting crosscurrents.
 530.94
535.00
Highlights
- Shares of Microsoft are trading at $532.13, rising by $2.88 over the past 7 days and maintaining a strong upward trend.
- The trend remains firmly positive with price trading above both 20-day and 50-day moving averages, supported by strong bullish indicators.
- Expected trading range for the coming week is $523.11 to $554.74, with immediate support at $524.52 and resistance at $544.67.
Cloud and AI adoption bolster sentiment as earnings drive expectations
Microsoft is set to release its fiscal 2027 first-quarter earnings on October 28, 2026, with expectations for continued revenue growth led by Azure cloud services and artificial intelligence offerings, according to Yahoo Finance. In its latest fiscal year, the company reported annual revenue of more than $331 billion, up 18% from the prior year, and Azure revenue surpassed $100 billion with 41% year-over-year growth (source: Yahoo Finance). Commercial cloud and AI product adoption remain key drivers for the week ahead.
Momentum divergence builds as bullish signals persist over the week
On the daily chart, the setup shows a sustained move higher with a firm trend, underlined by a trending structure and moderate volatility of 3.84%. The MACD is strongly bullish at 12.03, while Stochastic RSI is in the oversold zone at 8.05, revealing a mild divergence as short-term momentum cools even as trend signals remain robust. Immediate support is seen at $524.52, reinforced by the Ichimoku Kijun at $519.26, while resistance lies at $544.67. This positioning suggests a steady upside bias, but traders should monitor momentum signals closely for any early shifts.
Bullish range bias holds as breakout and retracement risks heighten
For the coming trading week, the expected range is $523.11 to $554.74, with a 76% probability of an increase and a 24% probability of a decrease. The base case is continued trading between $524.52 and $544.67 as the trend unfolds. A move above $544.67 would open scope for bullish extension toward the upper band of the expected range. Conversely, a drop below $524.52 would expose the stock to a deeper retracement toward $519.26 support.
Previously it was reported that analysts are increasingly favoring quality stocks with robust balance sheets and self-funded growth, placing companies like Microsoft at the forefront as market conditions remain challenging. The current technical setup reinforces this view, highlighting $544.67 as a key resistance level to watch for potential bullish extension in the upcoming trading sessions.






Latest Microsoft News




-
 Afghanistan
-
 Albania
-
 Algeria
-
 Angola
-
 Argentina
-
 Armenia
-
 Australia
-
 Austria
-
 Azerbaijan
-
 Bahamas
-
 Bahrain
-
 Bangladesh
-
 Belarus
-
 Belgium
-
 Bolivia
-
 Botswana
-
 Brazil
-
 Brunei
-
 Bulgaria
-
 Cambodia
-
 Cameroon
-
 Canada
-
 Chile
-
 China
-
 Colombia
-
 Congo
-
 Costa Rica
-
 Cote d'Ivoire
-
 Croatia
-
 Cuba
-
 Cyprus
-
 Czechia
-
 DR Congo
-
 Denmark
-
 Dominican Republic
-
 Ecuador
-
 Egypt
-
 El Salvador
-
 Estonia
-
 Eswatini
-
 Ethiopia
-
 Finland
-
 France
-
 Georgia
-
 Germany
-
 Ghana
-
 Greece
-
 Haiti
-
 Hong Kong
-
 Hungary
-
 India
-
 Indonesia
-
 Iran, Islamic republic
-
 Iraq
-
 Ireland
-
 Israel
-
 Italy
-
 Jamaica
-
 Japan
-
 Jordan
-
 Kazakhstan
-
 Kenya
-
 Korea
-
 Kuwait
-
 Kyrgyzstan
-
 Laos
-
 Latvia
-
 Lebanon
-
 Lesotho
-
 Libya
-
 Lithuania
-
 Luxembourg
-
 Madagascar
-
 Malaysia
-
 Malta
-
 Mauritius
-
 Mexico
-
 Moldova
-
 Mongolia
-
 Montenegro
-
 Morocco
-
 Mozambique
-
 Myanmar
-
 Namibia
-
 Nepal
-
 Netherlands
-
 New Zealand
-
 Nigeria
-
 North Macedonia
-
 Norway
-
 Oman
-
 Pakistan
-
 Palestine
-
 Panama
-
 Papua New Guinea
-
 Paraguay
-
 Peru
-
 Philippines
-
 Poland
-
 Portugal
-
 Puerto Rico
-
 Qatar
-
 Reunion
-
 Romania
-
 Rwanda
-
 Saudi Arabia
-
 Serbia
-
 Singapore
-
 Slovakia
-
 Slovenia
-
 Somalia
-
 South Africa
-
 Spain
-
 Sri Lanka
-
 Sweden
-
 Switzerland
-
 Syria
-
 Taiwan
-
 Tajikistan
-
 Tanzania
-
 Thailand
-
 Trinidad and Tobago
-
 Tunisia
-
 Turkey
-
 UAE
-
 Uganda
-
 Ukraine
-
 United Kingdom
-
United States
-
 Uruguay
-
 Uzbekistan
-
 Venezuela
-
 Vietnam
-
 Yemen
-
 Zambia
-
 Zimbabwe
- Forex
- Crypto












