

What's behind JD.com's latest 4.3% stock pullback?

Persistent selling pressure drove JD.com Inc ADR (JD) down 4.3% as technical momentum weighed on price action. The move is confirmed by sustained trading below all major moving averages and key resistance levels, underscoring bearish conviction.
 26.58
26.58
Highlights
- Shares of JD.com closed at $25.62, falling 4.3% and trading near session lows amid persistent downside pressure.
- The stock continues to trade beneath its 20-, 50-, and 200-day moving averages, reflecting ongoing selling across multiple timeframes.
- Technical indicators project a very high probability of further downside, with an expected five-day range of $25.18 to $26.75 and a baseline scenario of sideways movement near current levels.
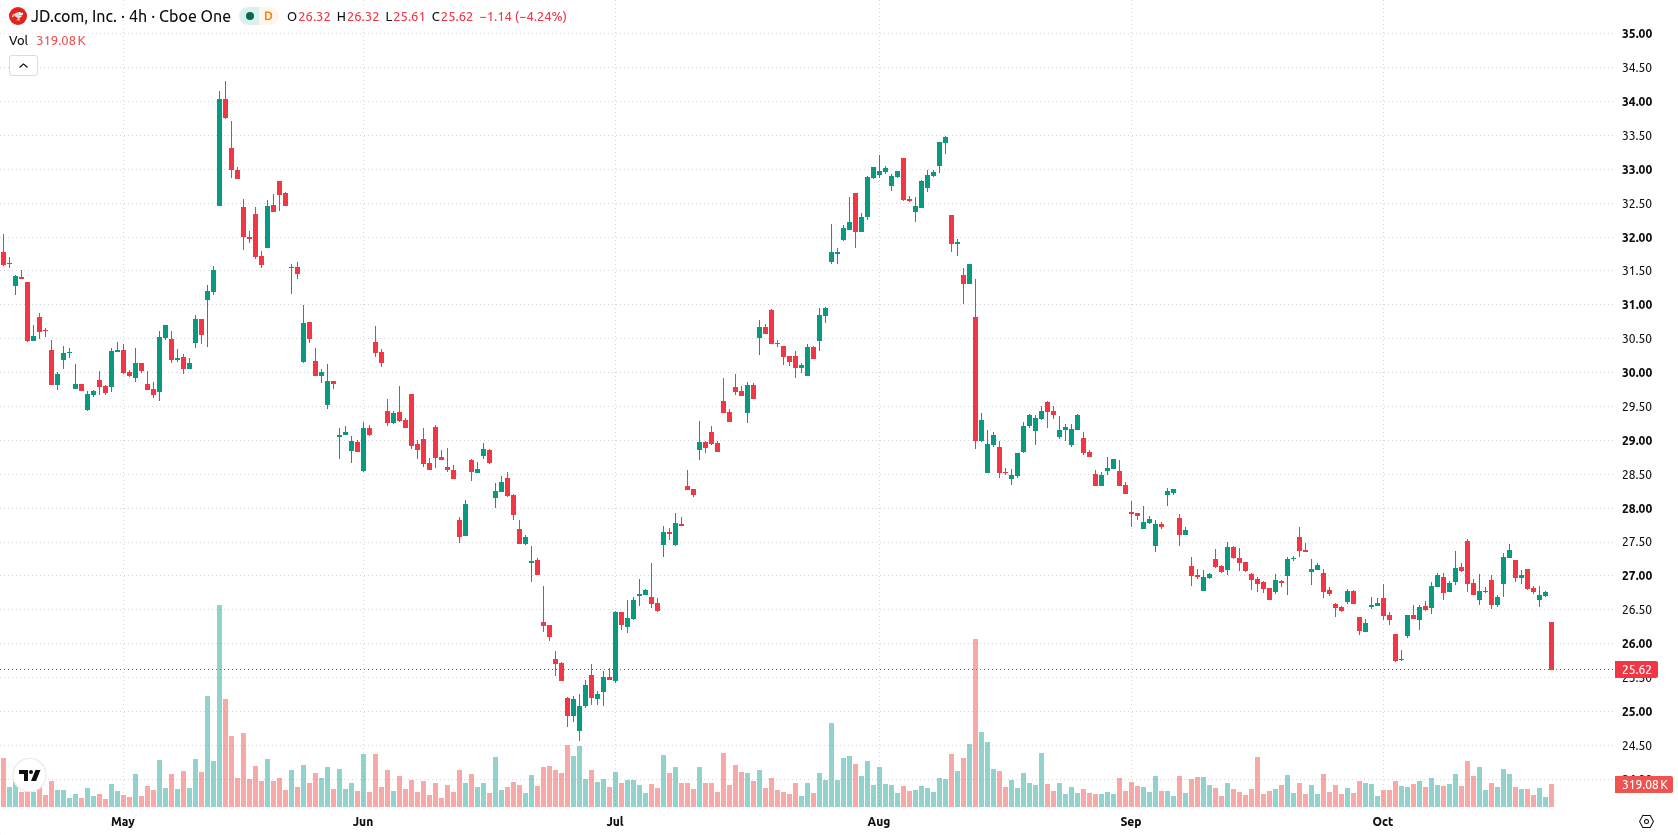
Broad bearish signals persist as price remains below major averages
JD.com is trading below its 20-, 50-, and 200-day moving averages ($26.70, $27.68, and $28.75 respectively), with price also held in check by the Ichimoku Kijun resistance at $26.72. This continuation of price action beneath key averages signals sustained selling pressure across short-, medium-, and long-term timeframes, further confirmed by the prevailing bearish alignment of the MA-50 versus MA-200. The near-term ceiling stands at $26.57 and floor support is at $25.18. Momentum readings show the MACD is a strong sell, and the ADX is neutral, highlighting waning trend strength but with a clear bearish bias. The RSI is at 46.08 with a sell signal, while the CCI and Stochastic RSI remain neutral, indicating neither overbought nor oversold conditions. Bull/Bear Power (BBP) is marginally positive at 0.01, pointing to a slight intraday dominance by buyers, though this is offset by overwhelmingly bearish signals from other momentum measures. The Awesome Oscillator remains neutral and does not provide additional trend confirmation. Intraday volatility is measured at 0.98%, with trading near session lows and persistent downside pressure following the open.
Earlier, analysts noted that JD.com faced persistent scrutiny over its ability to regain positive momentum as bearish signals continued to dominate its technical outlook. The current analysis reinforces this negative trend, highlighting a prevailing downside risk and suggesting traders closely monitor the $25.18 level as a significant point for further price deterioration.






Latest JD.com News





-
 Afghanistan
-
 Albania
-
 Algeria
-
 Angola
-
 Argentina
-
 Armenia
-
 Australia
-
 Austria
-
 Azerbaijan
-
 Bahamas
-
 Bahrain
-
 Bangladesh
-
 Belarus
-
 Belgium
-
 Bolivia
-
 Botswana
-
 Brazil
-
 Brunei
-
 Bulgaria
-
 Cambodia
-
 Cameroon
-
 Canada
-
 Chile
-
 China
-
 Colombia
-
 Congo
-
 Costa Rica
-
 Cote d'Ivoire
-
 Croatia
-
 Cuba
-
 Cyprus
-
 Czechia
-
 DR Congo
-
 Denmark
-
 Dominican Republic
-
 Ecuador
-
 Egypt
-
 El Salvador
-
 Estonia
-
 Eswatini
-
 Ethiopia
-
 Finland
-
 France
-
 Georgia
-
 Germany
-
 Ghana
-
 Greece
-
 Haiti
-
 Hong Kong
-
 Hungary
-
 India
-
 Indonesia
-
 Iran, Islamic republic
-
 Iraq
-
 Ireland
-
 Israel
-
 Italy
-
 Jamaica
-
 Japan
-
 Jordan
-
 Kazakhstan
-
 Kenya
-
 Korea
-
 Kuwait
-
 Kyrgyzstan
-
 Laos
-
 Latvia
-
 Lebanon
-
 Lesotho
-
 Libya
-
 Lithuania
-
 Luxembourg
-
 Madagascar
-
 Malaysia
-
 Malta
-
 Mauritius
-
 Mexico
-
 Moldova
-
 Mongolia
-
 Montenegro
-
 Morocco
-
 Mozambique
-
 Myanmar
-
 Namibia
-
 Nepal
-
 Netherlands
-
 New Zealand
-
 Nigeria
-
 North Macedonia
-
 Norway
-
 Oman
-
 Pakistan
-
 Palestine
-
 Panama
-
 Papua New Guinea
-
 Paraguay
-
 Peru
-
 Philippines
-
 Poland
-
 Portugal
-
 Puerto Rico
-
 Qatar
-
 Reunion
-
 Romania
-
 Rwanda
-
 Saudi Arabia
-
 Serbia
-
 Singapore
-
 Slovakia
-
 Slovenia
-
 Somalia
-
 South Africa
-
 Spain
-
 Sri Lanka
-
 Sweden
-
 Switzerland
-
 Syria
-
 Taiwan
-
 Tajikistan
-
 Tanzania
-
 Thailand
-
 Trinidad and Tobago
-
 Tunisia
-
 Turkey
-
 UAE
-
 Uganda
-
 Ukraine
-
 United Kingdom
-
United States
-
 Uruguay
-
 Uzbekistan
-
 Venezuela
-
 Vietnam
-
 Yemen
-
 Zambia
-
 Zimbabwe
- Forex
- Crypto












