

Procter & Gamble stock posts upward price move as buyer support emerges despite mixed momentum indicators

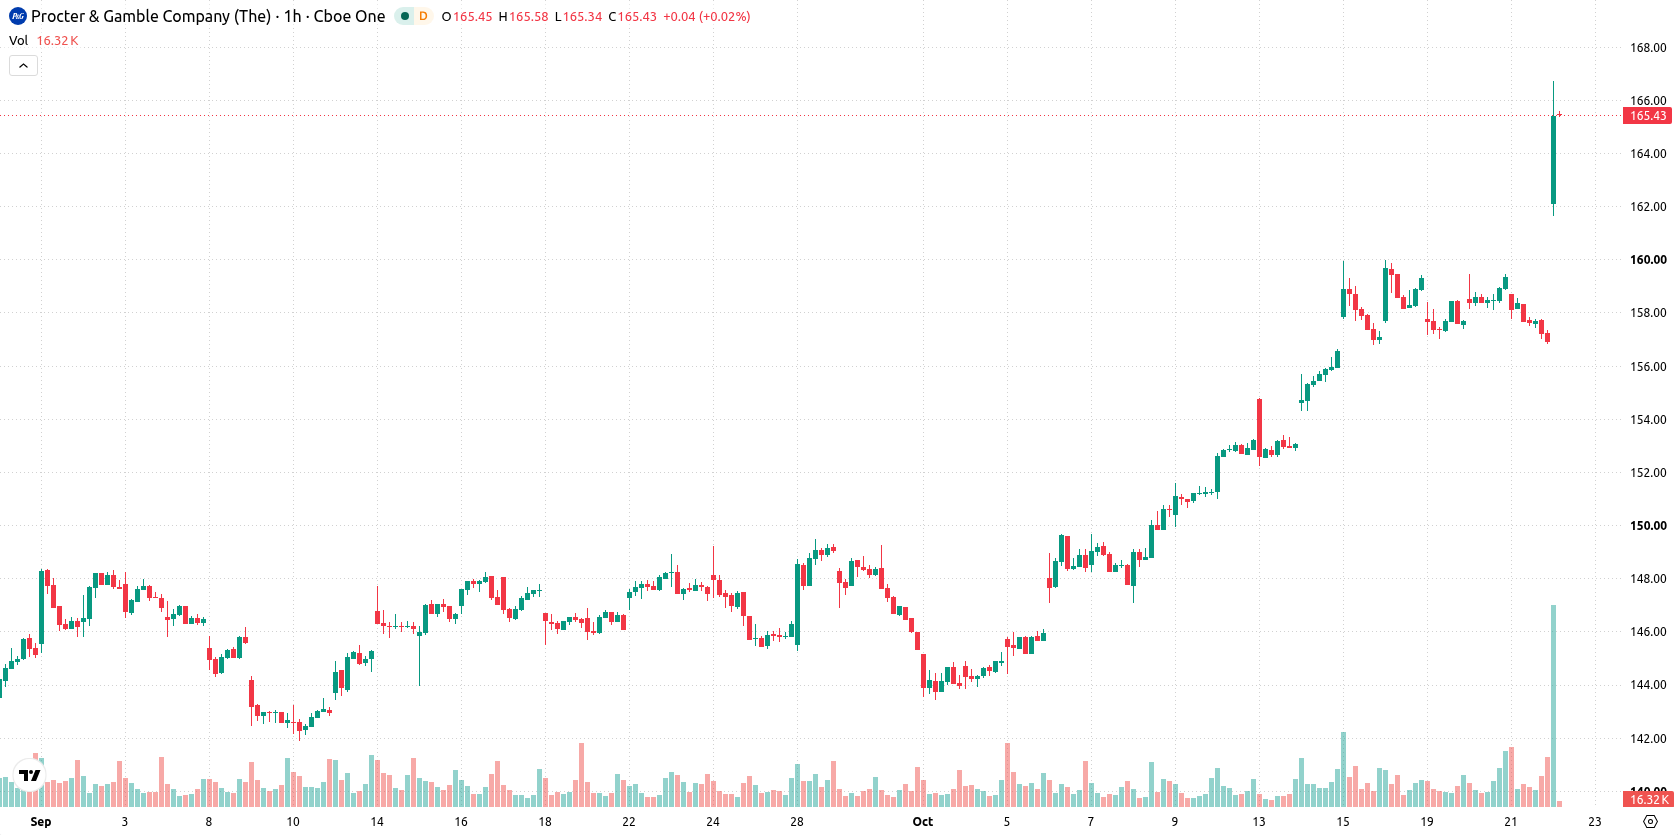
Procter & Gamble (PG) stock is trading at $165.39, posting a strong daily gain of 5.32%. The price is positioned above its key short- and medium-term moving averages and remains well supported on the longer-term trend.
 163.57
Highlights
- Procter & Gamble reported fiscal Q1 2027 earnings per share of $2.00, excluding restructuring, exceeding Wall Street estimates.
- Quarterly revenue totaled $23.3 billion with 4% organic sales growth, and the company plans over $10 billion in dividends and $5 billion in share repurchases for fiscal 2027.
- Shares of Procter & Gamble rose 5.32% to $165.39 with technical signals indicating mixed momentum, an expected trading range of $155.69 to $166.79 over the next 2 to 3 days, and a slightly higher probability of a move down than up.
Earnings beat and capital returns drive renewed investor optimism
Procter & Gamble reported fiscal first-quarter 2027 earnings per share of $2.00, excluding restructuring items, outpacing Wall Street estimates and signaling stronger-than-expected profitability, according to CNBC. Quarterly revenue reached $23.3 billion, reinforcing robust demand across the company's product lines, while organic sales growth of 4% highlighted underlying operational momentum. The company also maintained its commitment to return over $10 billion in dividends and $5 billion in share repurchases during fiscal 2027, according to Benzinga, with strong performances from the beauty, grooming, and fabric care segments further supporting positive sentiment.
Intraday seller dominance as mixed signals bracket price range
On the hourly chart, PG is trading above both the MA-20 and MA-50, and remains well above the MA-200 on the daily timeframe. Immediate support is marked by the Ichimoku Kijun at $158.14. The expected price range over the next 2–3 days is $155.69 to $166.79. Momentum signals are mixed: MACD is neutral and ADX signals sell, while RSI stands at 42.93, with Stochastic RSI, CCI, and Bull/Bear Power indicating oversold or continued selling pressure. Bull/Bear Power reflects seller dominance in intraday action, and the Awesome Oscillator is aligned with further selling pressure.
Near-term consolidation outlook as directional risk stays balanced
In the short term, PG is likely to consolidate within a sideways band between $155.69 and $166.79, reflecting typical volatility around current levels. Current probabilities marginally favor a move down (52%) versus up (48%). A clear break above the $166.79 resistance would open the way for renewed upside momentum, while a fall below $155.69 support may accelerate declines. Baseline expectations see price stabilizing within this established range until a stronger directional catalyst emerges.
Previously it was reported that Procter & Gamble continues to face elevated cost pressures from higher raw material, energy, and transportation expenses impacting its profit outlook. The current technical setup indicates the stock is consolidating within a defined range, so traders should monitor for a decisive break above $166.79 resistance or below $155.69 support to signal the next directional move.






Latest Procter & Gamble News





-
 Afghanistan
-
 Albania
-
 Algeria
-
 Angola
-
 Argentina
-
 Armenia
-
 Australia
-
 Austria
-
 Azerbaijan
-
 Bahamas
-
 Bahrain
-
 Bangladesh
-
 Belarus
-
 Belgium
-
 Bolivia
-
 Botswana
-
 Brazil
-
 Brunei
-
 Bulgaria
-
 Cambodia
-
 Cameroon
-
 Canada
-
 Chile
-
 China
-
 Colombia
-
 Congo
-
 Costa Rica
-
 Cote d'Ivoire
-
 Croatia
-
 Cuba
-
 Cyprus
-
 Czechia
-
 DR Congo
-
 Denmark
-
 Dominican Republic
-
 Ecuador
-
 Egypt
-
 El Salvador
-
 Estonia
-
 Eswatini
-
 Ethiopia
-
 Finland
-
 France
-
 Georgia
-
 Germany
-
 Ghana
-
 Greece
-
 Haiti
-
 Hong Kong
-
 Hungary
-
 India
-
 Indonesia
-
 Iran, Islamic republic
-
 Iraq
-
 Ireland
-
 Israel
-
 Italy
-
 Jamaica
-
 Japan
-
 Jordan
-
 Kazakhstan
-
 Kenya
-
 Korea
-
 Kuwait
-
 Kyrgyzstan
-
 Laos
-
 Latvia
-
 Lebanon
-
 Lesotho
-
 Libya
-
 Lithuania
-
 Luxembourg
-
 Madagascar
-
 Malaysia
-
 Malta
-
 Mauritius
-
 Mexico
-
 Moldova
-
 Mongolia
-
 Montenegro
-
 Morocco
-
 Mozambique
-
 Myanmar
-
 Namibia
-
 Nepal
-
 Netherlands
-
 New Zealand
-
 Nigeria
-
 North Macedonia
-
 Norway
-
 Oman
-
 Pakistan
-
 Palestine
-
 Panama
-
 Papua New Guinea
-
 Paraguay
-
 Peru
-
 Philippines
-
 Poland
-
 Portugal
-
 Puerto Rico
-
 Qatar
-
 Reunion
-
 Romania
-
 Rwanda
-
 Saudi Arabia
-
 Serbia
-
 Singapore
-
 Slovakia
-
 Slovenia
-
 Somalia
-
 South Africa
-
 Spain
-
 Sri Lanka
-
 Sweden
-
 Switzerland
-
 Syria
-
 Taiwan
-
 Tajikistan
-
 Tanzania
-
 Thailand
-
 Trinidad and Tobago
-
 Tunisia
-
 Turkey
-
 UAE
-
 Uganda
-
 Ukraine
-
 United Kingdom
-
United States
-
 Uruguay
-
 Uzbekistan
-
 Venezuela
-
 Vietnam
-
 Yemen
-
 Zambia
-
 Zimbabwe
- Forex
- Crypto












