

BTBT falls as seller pressure dominates intraday trading

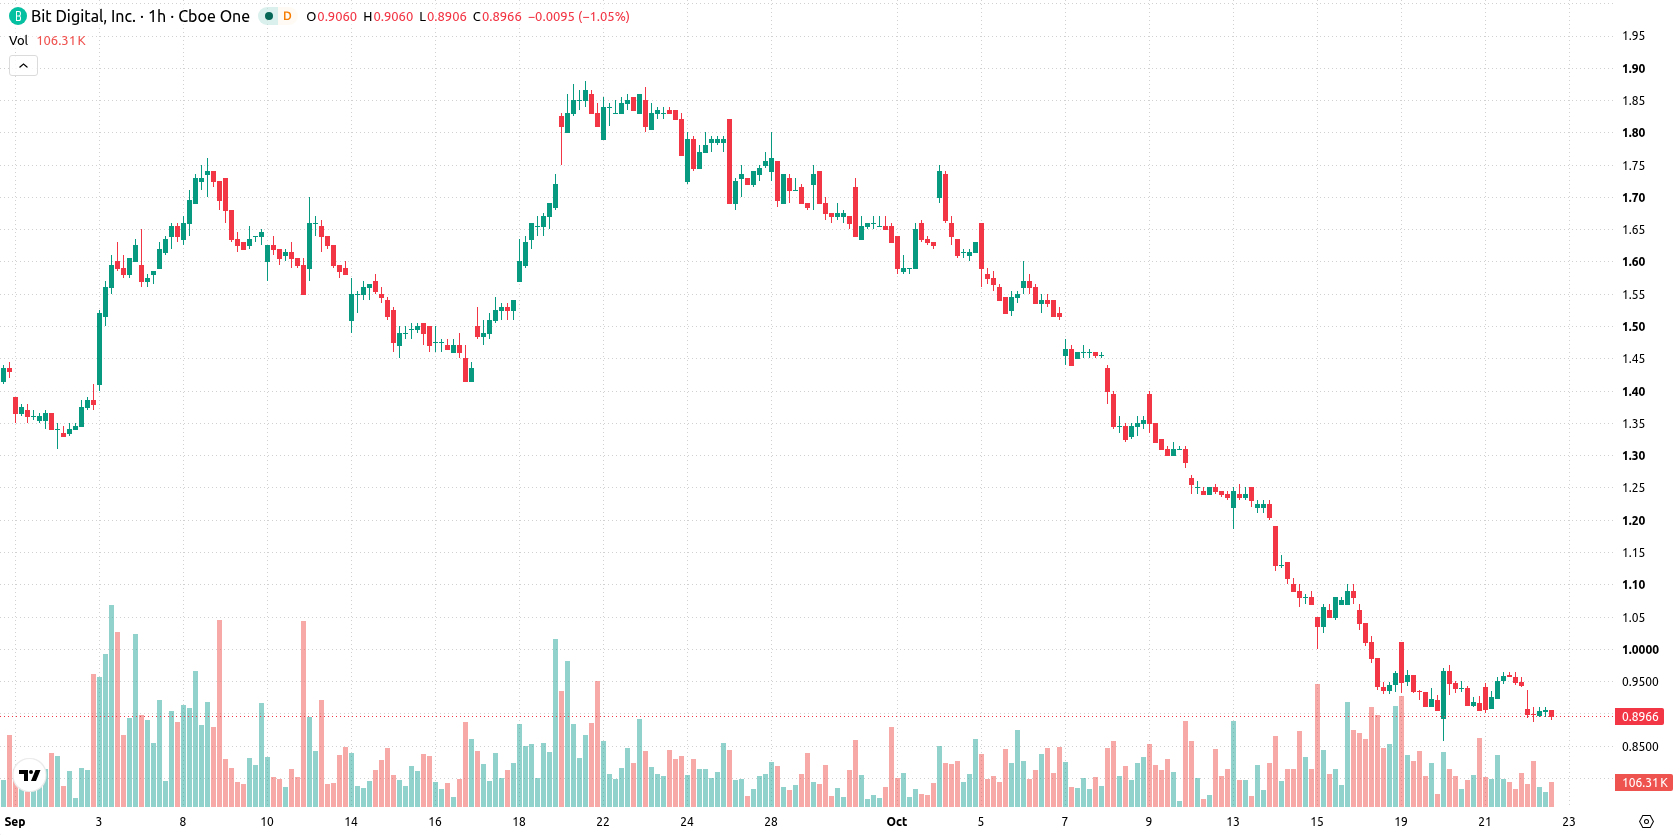
Bit Digital (BTBT) stock is trading at $0.89 after dropping 5.6% on the day, remaining under its key moving averages. Price action sits near today's lows, reflecting continued weakness amid increased volatility.
 0.9610
Highlights
- BTBT/USD trades below key short and long-term moving averages, indicating sustained downside pressure across all timeframes.
- Technical momentum indicators collectively show a strong selling environment, with negative readings and oversold conditions prevailing.
- The current trading range is expected to stay between $0.79 to $0.99, with high probability of further declines unless $0.93 is reclaimed.
Bearish technical momentum as price holds below key averages
On the technical front, BTBT/USD remains below the MA-20 at $0.93 and the MA-50 at $1 on the hourly chart, and is also trading below the long-term MA-200 at $1.67 on the daily timeframe. The Ichimoku Kijun at $0.93 serves as immediate resistance. Momentum indicators are negative: MACD gives a Strong Sell reading, ADX confirms a strong downtrend, and Bull/Bear Power points to ongoing seller dominance intraday. RSI stands at 35.62 (Sell), CCI is firmly in oversold territory, and Stochastic RSI is neutral, while the Awesome Oscillator continues to reflect negative momentum. Price action shows no evidence of bullish divergence, supporting the overall bearish technical picture.
Further downside risk as sellers restrict rebound potential
In the short term, BTBT is expected to remain volatile within a range of $0.79 to $0.99. The probability of a further move higher remains very low, with a strong likelihood of continued downside. The baseline scenario sees price fluctuating within this range as sellers maintain pressure. A break above the $0.93 resistance could trigger a corrective rebound, while a drop below $0.79 would likely accelerate the existing downtrend.
Earlier, analysts noted that Bit Digital was exhibiting persistent technical weakness and a bearish trend. The current analysis reinforces this outlook, highlighting the importance of the $0.93 resistance and $0.79 support as key levels to monitor for any breakout that could define the stock's next directional move.






Latest Bit Digital News



-
 Afghanistan
-
 Albania
-
 Algeria
-
 Angola
-
 Argentina
-
 Armenia
-
 Australia
-
 Austria
-
 Azerbaijan
-
 Bahamas
-
 Bahrain
-
 Bangladesh
-
 Belarus
-
 Belgium
-
 Bolivia
-
 Botswana
-
 Brazil
-
 Brunei
-
 Bulgaria
-
 Cambodia
-
 Cameroon
-
 Canada
-
 Chile
-
 China
-
 Colombia
-
 Congo
-
 Costa Rica
-
 Cote d'Ivoire
-
 Croatia
-
 Cuba
-
 Cyprus
-
 Czechia
-
 DR Congo
-
 Denmark
-
 Dominican Republic
-
 Ecuador
-
 Egypt
-
 El Salvador
-
 Estonia
-
 Eswatini
-
 Ethiopia
-
 Finland
-
 France
-
 Georgia
-
 Germany
-
 Ghana
-
 Greece
-
 Haiti
-
 Hong Kong
-
 Hungary
-
 India
-
 Indonesia
-
 Iran, Islamic republic
-
 Iraq
-
 Ireland
-
 Israel
-
 Italy
-
 Jamaica
-
 Japan
-
 Jordan
-
 Kazakhstan
-
 Kenya
-
 Korea
-
 Kuwait
-
 Kyrgyzstan
-
 Laos
-
 Latvia
-
 Lebanon
-
 Lesotho
-
 Libya
-
 Lithuania
-
 Luxembourg
-
 Madagascar
-
 Malaysia
-
 Malta
-
 Mauritius
-
 Mexico
-
 Moldova
-
 Mongolia
-
 Montenegro
-
 Morocco
-
 Mozambique
-
 Myanmar
-
 Namibia
-
 Nepal
-
 Netherlands
-
 New Zealand
-
 Nigeria
-
 North Macedonia
-
 Norway
-
 Oman
-
 Pakistan
-
 Palestine
-
 Panama
-
 Papua New Guinea
-
 Paraguay
-
 Peru
-
 Philippines
-
 Poland
-
 Portugal
-
 Puerto Rico
-
 Qatar
-
 Reunion
-
 Romania
-
 Rwanda
-
 Saudi Arabia
-
 Serbia
-
 Singapore
-
 Slovakia
-
 Slovenia
-
 Somalia
-
 South Africa
-
 Spain
-
 Sri Lanka
-
 Sweden
-
 Switzerland
-
 Syria
-
 Taiwan
-
 Tajikistan
-
 Tanzania
-
 Thailand
-
 Trinidad and Tobago
-
 Tunisia
-
 Turkey
-
 UAE
-
 Uganda
-
 Ukraine
-
 United Kingdom
-
United States
-
 Uruguay
-
 Uzbekistan
-
 Venezuela
-
 Vietnam
-
 Yemen
-
 Zambia
-
 Zimbabwe
- Forex
- Crypto












