

SNDL stock consolidates near support as buying signals counter mixed indicators

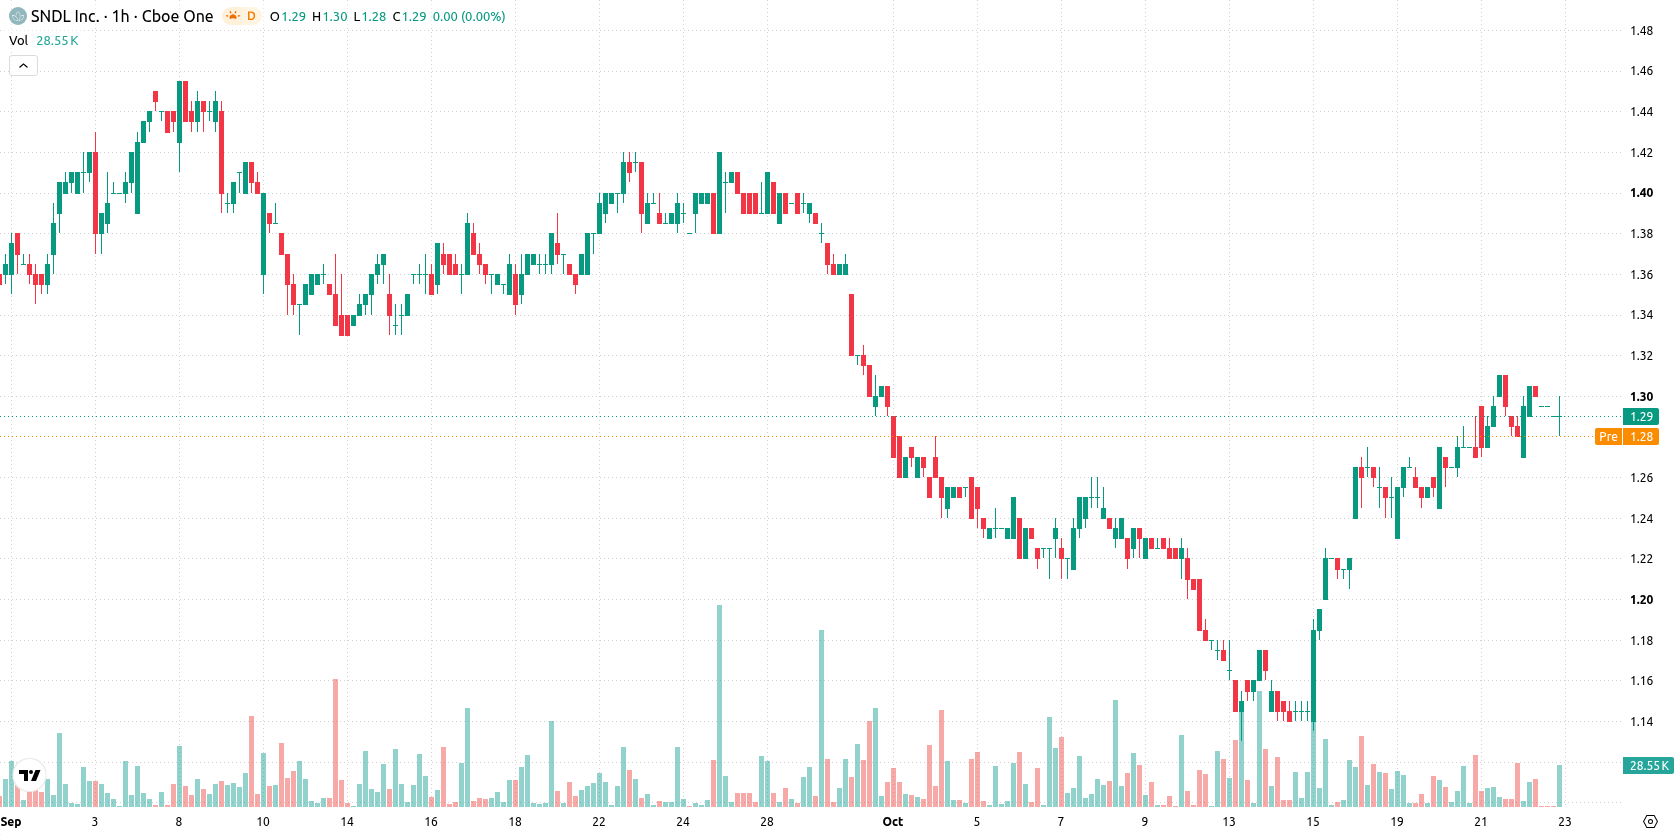
SNDL (SNDL) stock is trading at $1.29 after a modest rise today. The price sits above its key moving averages, suggesting short-term positive momentum.
 1.30
1.34
Highlights
- SNDL stock trades above short- and medium-term averages but remains under its long-term trend line, showing a bullish bias within a broader bearish pattern.
- Momentum signals are strongly positive, with buyers dominating, but some short-term oscillators indicate possible consolidation ahead.
- Price is at $1.29, with expected trading between $1.26 to $1.32; a move above or below this range would suggest a direction shift.
Diverging momentum and oscillators as consolidation risk emerges
On the technical front, SNDL is trading above its MA-20 and MA-50 on the hourly chart, while remaining below the long-term MA-200. The Ichimoku Kijun stands at $1.27, marking immediate support. Momentum indicators present a mixed picture: MACD and ADX both highlight continued buying strength, while RSI sits at 59.97, Stoch RSI is oversold, and CCI is neutral. Bull/Bear Power confirms buyer dominance, with the Awesome Oscillator remaining neutral. There is a notable divergence between strong momentum signals and oscillators, which may indicate consolidation in the short term.
Upward breakout favored as volatility narrows trading range
Looking ahead, SNDL is expected to trade within a volatility band from $1.26 to $1.32 over the next several sessions. The baseline scenario envisions the stock holding steady within this corridor, with a 79% probability of an upward move, while the likelihood of a downturn is 21%. Sustained bullish momentum could lead to a breakout above the upper end of the range, whereas a drop below $1.27 support would indicate elevated downside risk.
Earlier, analysts noted that SNDL was likely to remain range-bound, with technical momentum offering a modest upside bias. The current analysis adds that, while short-term momentum remains positive, traders should watch for a potential breakout above $1.32 or a move below $1.27 as signals of renewed directional risk.






Latest SNDL News



-
 Afghanistan
-
 Albania
-
 Algeria
-
 Angola
-
 Argentina
-
 Armenia
-
 Australia
-
 Austria
-
 Azerbaijan
-
 Bahamas
-
 Bahrain
-
 Bangladesh
-
 Belarus
-
 Belgium
-
 Bolivia
-
 Botswana
-
 Brazil
-
 Brunei
-
 Bulgaria
-
 Cambodia
-
 Cameroon
-
 Canada
-
 Chile
-
 China
-
 Colombia
-
 Congo
-
 Costa Rica
-
 Cote d'Ivoire
-
 Croatia
-
 Cuba
-
 Cyprus
-
 Czechia
-
 DR Congo
-
 Denmark
-
 Dominican Republic
-
 Ecuador
-
 Egypt
-
 El Salvador
-
 Estonia
-
 Eswatini
-
 Ethiopia
-
 Finland
-
 France
-
 Georgia
-
 Germany
-
 Ghana
-
 Greece
-
 Haiti
-
 Hong Kong
-
 Hungary
-
 India
-
 Indonesia
-
 Iran, Islamic republic
-
 Iraq
-
 Ireland
-
 Israel
-
 Italy
-
 Jamaica
-
 Japan
-
 Jordan
-
 Kazakhstan
-
 Kenya
-
 Korea
-
 Kuwait
-
 Kyrgyzstan
-
 Laos
-
 Latvia
-
 Lebanon
-
 Lesotho
-
 Libya
-
 Lithuania
-
 Luxembourg
-
 Madagascar
-
 Malaysia
-
 Malta
-
 Mauritius
-
 Mexico
-
 Moldova
-
 Mongolia
-
 Montenegro
-
 Morocco
-
 Mozambique
-
 Myanmar
-
 Namibia
-
 Nepal
-
 Netherlands
-
 New Zealand
-
 Nigeria
-
 North Macedonia
-
 Norway
-
 Oman
-
 Pakistan
-
 Palestine
-
 Panama
-
 Papua New Guinea
-
 Paraguay
-
 Peru
-
 Philippines
-
 Poland
-
 Portugal
-
 Puerto Rico
-
 Qatar
-
 Reunion
-
 Romania
-
 Rwanda
-
 Saudi Arabia
-
 Serbia
-
 Singapore
-
 Slovakia
-
 Slovenia
-
 Somalia
-
 South Africa
-
 Spain
-
 Sri Lanka
-
 Sweden
-
 Switzerland
-
 Syria
-
 Taiwan
-
 Tajikistan
-
 Tanzania
-
 Thailand
-
 Trinidad and Tobago
-
 Tunisia
-
 Turkey
-
 UAE
-
 Uganda
-
 Ukraine
-
 United Kingdom
-
United States
-
 Uruguay
-
 Uzbekistan
-
 Venezuela
-
 Vietnam
-
 Yemen
-
 Zambia
-
 Zimbabwe
- Forex
- Crypto












