

American Airlines shares technical analysis: Price hovers near $11.44 support after sharp decline

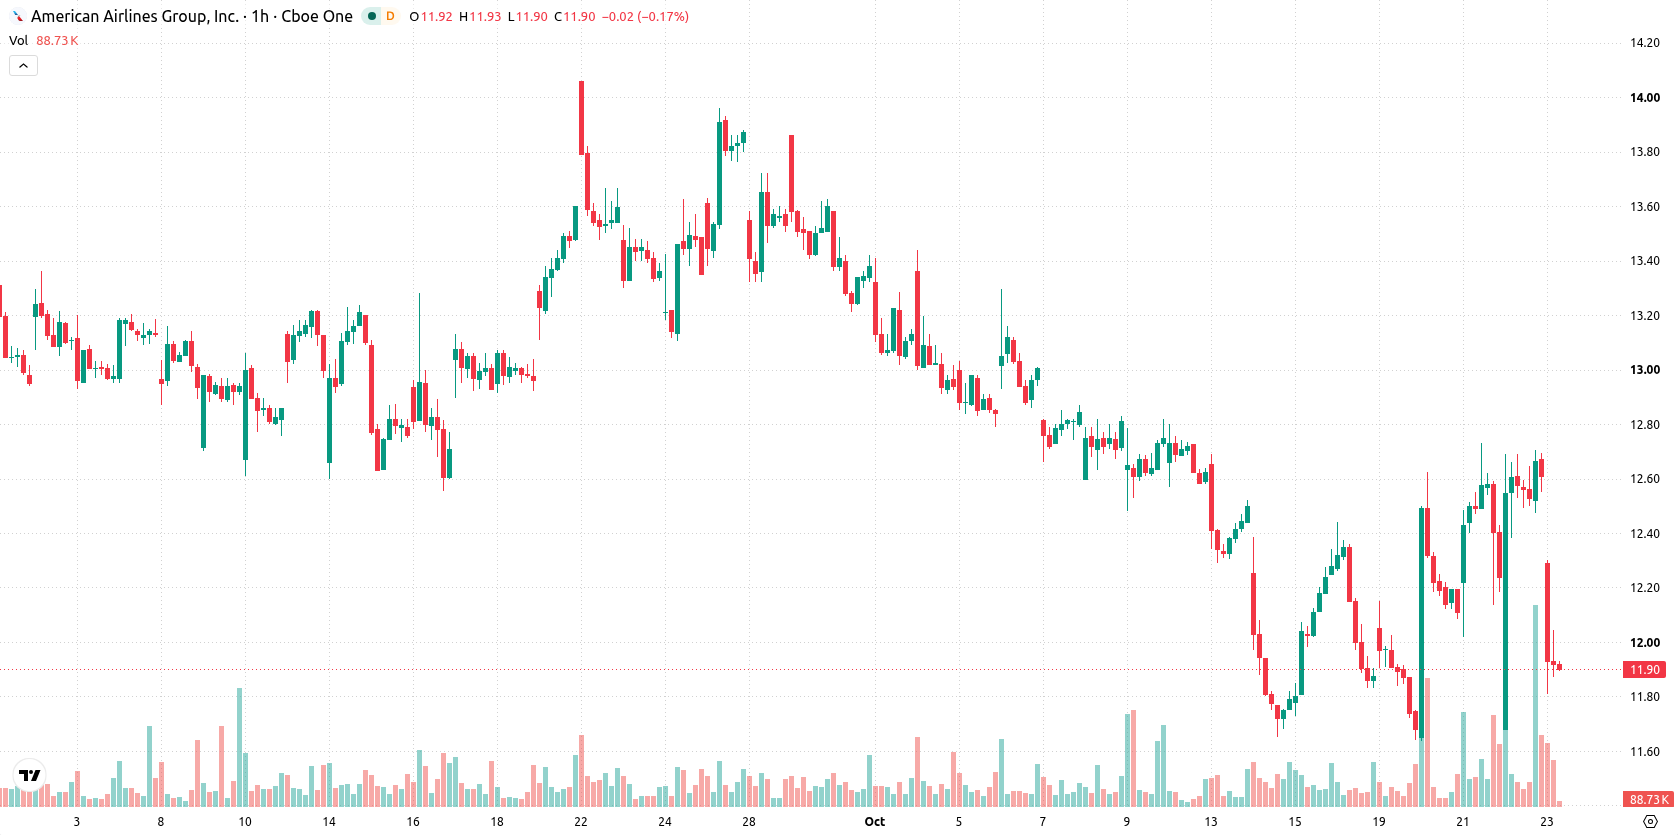
American Airlines (AAL) stock is trading at $11.92, falling 5.44% on the session and ending near its daily lows. The share price currently sits below all key moving averages, indicating persistent seller control throughout multiple timeframes.
 13.55
14.33
Highlights
- American Airlines reported third-quarter 2026 revenue of $16.3 billion, up 19.3% year over year.
- Higher fuel costs of $1.9 billion resulted in a net loss of $269 million for the quarter.
- Shares of American Airlines closed at $11.92, with price action consolidating between $11.44 to $12.76 and a 74% probability of further downside.
Rising revenue offset by fuel-driven losses widen bearish sentiment
American Airlines reported third-quarter 2026 revenue of $16.3 billion, marking a 19.3% increase compared to the previous year. However, sharply higher fuel costs totaling $1.9 billion outweighed this gain, resulting in a net loss of $269 million for the quarter. The substantial increase in operating expenses has weighed on the airline's earnings performance and contributed to muted sentiment around the stock.
Resistance levels reinforced as momentum signals remain divided
Technically, AAL faces notable resistance at the Ichimoku Kijun level of $12.19 and is trading below its MA-20 ($12.43), MA-50 ($12.17), and MA-200 ($13.62), confirming a multi-timeframe ceiling. On the downside, immediate support sits at $11.44, while the technical range extends up to $12.76. Momentum signals remain conflicted: MACD signals Buy and RSI and CCI both support a rebound, but ADX points to a Sell, Stoch RSI registers a Strong Sell, and Bull/Bear Power favors buyers only on the intraday timeframes. The Awesome Oscillator aligns with current trend pressure.
Downside bias persists as volatility defines trading range
In the short term, the expected price range for AAL is projected between $11.44 and $12.76, based on recent volatility. There is a 74% probability of further downside versus a 26% chance of recovery. If the price breaks above $12.19, a move toward the upper range is possible, while a breach of $11.44 support would likely accelerate losses. Baseline expectation is for consolidation within this volatility band.
Earlier, analysts noted that U.S. airlines were prioritizing higher margins over passenger volume to counteract rising jet fuel costs, even as this strategy risked suppressing future demand growth. The latest results from American Airlines reinforce the ongoing margin pressures, highlighting the importance of monitoring the $11.44 support level as a near-term downside risk for the stock.










-
 Afghanistan
-
 Albania
-
 Algeria
-
 Angola
-
 Argentina
-
 Armenia
-
 Australia
-
 Austria
-
 Azerbaijan
-
 Bahamas
-
 Bahrain
-
 Bangladesh
-
 Belarus
-
 Belgium
-
 Bolivia
-
 Botswana
-
 Brazil
-
 Brunei
-
 Bulgaria
-
 Cambodia
-
 Cameroon
-
 Canada
-
 Chile
-
 China
-
 Colombia
-
 Congo
-
 Costa Rica
-
 Cote d'Ivoire
-
 Croatia
-
 Cuba
-
 Cyprus
-
 Czechia
-
 DR Congo
-
 Denmark
-
 Dominican Republic
-
 Ecuador
-
 Egypt
-
 El Salvador
-
 Estonia
-
 Eswatini
-
 Ethiopia
-
 Finland
-
 France
-
 Georgia
-
 Germany
-
 Ghana
-
 Greece
-
 Haiti
-
 Hong Kong
-
 Hungary
-
 India
-
 Indonesia
-
 Iran, Islamic republic
-
 Iraq
-
 Ireland
-
 Israel
-
 Italy
-
 Jamaica
-
 Japan
-
 Jordan
-
 Kazakhstan
-
 Kenya
-
 Korea
-
 Kuwait
-
 Kyrgyzstan
-
 Laos
-
 Latvia
-
 Lebanon
-
 Lesotho
-
 Libya
-
 Lithuania
-
 Luxembourg
-
 Madagascar
-
 Malaysia
-
 Malta
-
 Mauritius
-
 Mexico
-
 Moldova
-
 Mongolia
-
 Montenegro
-
 Morocco
-
 Mozambique
-
 Myanmar
-
 Namibia
-
 Nepal
-
 Netherlands
-
 New Zealand
-
 Nigeria
-
 North Macedonia
-
 Norway
-
 Oman
-
 Pakistan
-
 Palestine
-
 Panama
-
 Papua New Guinea
-
 Paraguay
-
 Peru
-
 Philippines
-
 Poland
-
 Portugal
-
 Puerto Rico
-
 Qatar
-
 Reunion
-
 Romania
-
 Rwanda
-
 Saudi Arabia
-
 Serbia
-
 Singapore
-
 Slovakia
-
 Slovenia
-
 Somalia
-
 South Africa
-
 Spain
-
 Sri Lanka
-
 Sweden
-
 Switzerland
-
 Syria
-
 Taiwan
-
 Tajikistan
-
 Tanzania
-
 Thailand
-
 Trinidad and Tobago
-
 Tunisia
-
 Turkey
-
 UAE
-
 Uganda
-
 Ukraine
-
 United Kingdom
-
United States
-
 Uruguay
-
 Uzbekistan
-
 Venezuela
-
 Vietnam
-
 Yemen
-
 Zambia
-
 Zimbabwe
- Forex
- Crypto












