


Las Vegas Sands Corp (LVS) dropped 3.2% after reporting quarterly earnings and revenue below analyst expectations, triggering a sharp selloff in the shares. The slide is reinforced by persistent technical weakness, as LVS trades below all major moving averages and faces downside pressure from sustained bearish momentum.
 40.45
41.72
Highlights
- Las Vegas Sands reported Q3 2026 adjusted earnings and revenue below expectations as demand slowed in Singapore and Macao.
- The company repurchased $950 million in shares and cut its outstanding share count by 19% over three years, raising its dividend 20% to $0.36 per share.
- Las Vegas Sands stock trades below key moving averages with bearish momentum and is projected to range from $33.8 to $36.88 over the next five days.
Profit declines and capital returns amid weak premium demand
Las Vegas Sands reported adjusted earnings and revenue below expectations for Q3 2026. The company experienced reduced high-end customer demand in Singapore and Macao, resulting in lower profits, but recorded strong EBITDA of $590 million in Singapore and $529 million in Macao. During the quarter, LVS repurchased $950 million of its shares and reduced its outstanding share count by 19% over three years, while the board approved a 20% increase in the quarterly dividend to $0.36 per share. Management reaffirmed long-term investment plans and ongoing capital returns, though price action has remained under broader selling pressure.
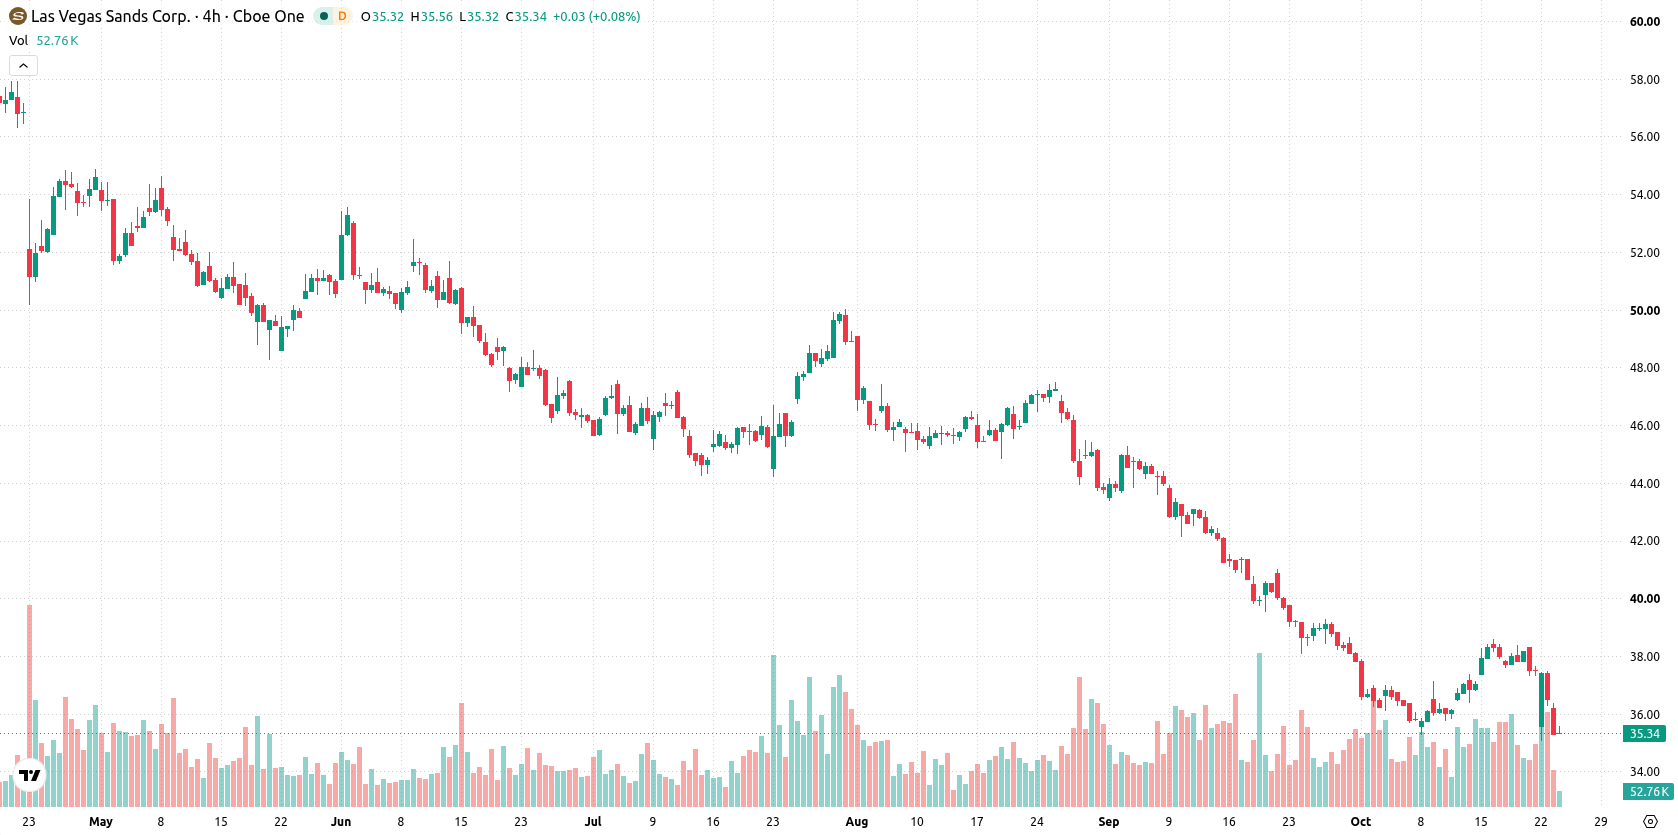
Selling intensifies as bearish momentum and oversold signals dominate
LVS is trading below its 20-day ($37.22), 50-day ($41.07), and 200-day ($49.69) moving averages, reflecting strong selling and firm bearish momentum across all timeframes. Immediate resistance is at $36.35, with primary support at $35.31, both confirming downside pressure given the alignment of longer-term averages. Momentum indicators are distinctly negative: the MACD signals a Strong Sell, and the ADX at 42.85 indicates a robust downtrend. The RSI at 34.71 and CCI at -66.4 both point to oversold conditions, while Bull/Bear Power at 0.03 hints at only slight intraday buyer activity. Overall, momentum and levels align with persistent negative sentiment, reinforced by a session-low trade and notable intraday volatility of 2.95%.
Previously it was reported that major share purchases by high-profile investors have led to notable shifts in trading activity and company ownership in the gaming sector. In contrast, Las Vegas Sands now faces intensified downside pressure following disappointing earnings, with traders advised to monitor the risk of a breakdown below the primary support as volatility persists.






Latest Las Vegas Sands Corp News




-
 Afghanistan
-
 Albania
-
 Algeria
-
 Angola
-
 Argentina
-
 Armenia
-
 Australia
-
 Austria
-
 Azerbaijan
-
 Bahamas
-
 Bahrain
-
 Bangladesh
-
 Belarus
-
 Belgium
-
 Bolivia
-
 Botswana
-
 Brazil
-
 Brunei
-
 Bulgaria
-
 Cambodia
-
 Cameroon
-
 Canada
-
 Chile
-
 China
-
 Colombia
-
 Congo
-
 Costa Rica
-
 Cote d'Ivoire
-
 Croatia
-
 Cuba
-
 Cyprus
-
 Czechia
-
 DR Congo
-
 Denmark
-
 Dominican Republic
-
 Ecuador
-
 Egypt
-
 El Salvador
-
 Estonia
-
 Eswatini
-
 Ethiopia
-
 Finland
-
 France
-
 Georgia
-
 Germany
-
 Ghana
-
 Greece
-
 Haiti
-
 Hong Kong
-
 Hungary
-
 India
-
 Indonesia
-
 Iran, Islamic republic
-
 Iraq
-
 Ireland
-
 Israel
-
 Italy
-
 Jamaica
-
 Japan
-
 Jordan
-
 Kazakhstan
-
 Kenya
-
 Korea
-
 Kuwait
-
 Kyrgyzstan
-
 Laos
-
 Latvia
-
 Lebanon
-
 Lesotho
-
 Libya
-
 Lithuania
-
 Luxembourg
-
 Madagascar
-
 Malaysia
-
 Malta
-
 Mauritius
-
 Mexico
-
 Moldova
-
 Mongolia
-
 Montenegro
-
 Morocco
-
 Mozambique
-
 Myanmar
-
 Namibia
-
 Nepal
-
 Netherlands
-
 New Zealand
-
 Nigeria
-
 North Macedonia
-
 Norway
-
 Oman
-
 Pakistan
-
 Palestine
-
 Panama
-
 Papua New Guinea
-
 Paraguay
-
 Peru
-
 Philippines
-
 Poland
-
 Portugal
-
 Puerto Rico
-
 Qatar
-
 Reunion
-
 Romania
-
 Rwanda
-
 Saudi Arabia
-
 Serbia
-
 Singapore
-
 Slovakia
-
 Slovenia
-
 Somalia
-
 South Africa
-
 Spain
-
 Sri Lanka
-
 Sweden
-
 Switzerland
-
 Syria
-
 Taiwan
-
 Tajikistan
-
 Tanzania
-
 Thailand
-
 Trinidad and Tobago
-
 Tunisia
-
 Turkey
-
 UAE
-
 Uganda
-
 Ukraine
-
 United Kingdom
-
United States
-
 Uruguay
-
 Uzbekistan
-
 Venezuela
-
 Vietnam
-
 Yemen
-
 Zambia
-
 Zimbabwe
- Forex
- Crypto












