

What's behind Liberty Global's latest 3.3% stock pullback?

Liberty Global plc (LBTYA) dropped 3.31% as persistent technical selling pressure weighed on the stock, with no corporate news catalyst on the day. The latest decline is supported by the asset trading below all key moving averages and a sustained bearish trend structure.
 9.97
9.98
Highlights
- Shares of Liberty Global trade below key moving averages, confirming sustained selling pressure across all observed timeframes.
- Technical momentum indicators remain negative, with strong selling signals on MACD, ADX, and CCI, and Stochastic RSI showing an overbought condition.
- The expected price range for the next five sessions is $7.32 to $7.9, with over 80% probability of a downward move absent a close above $7.81.
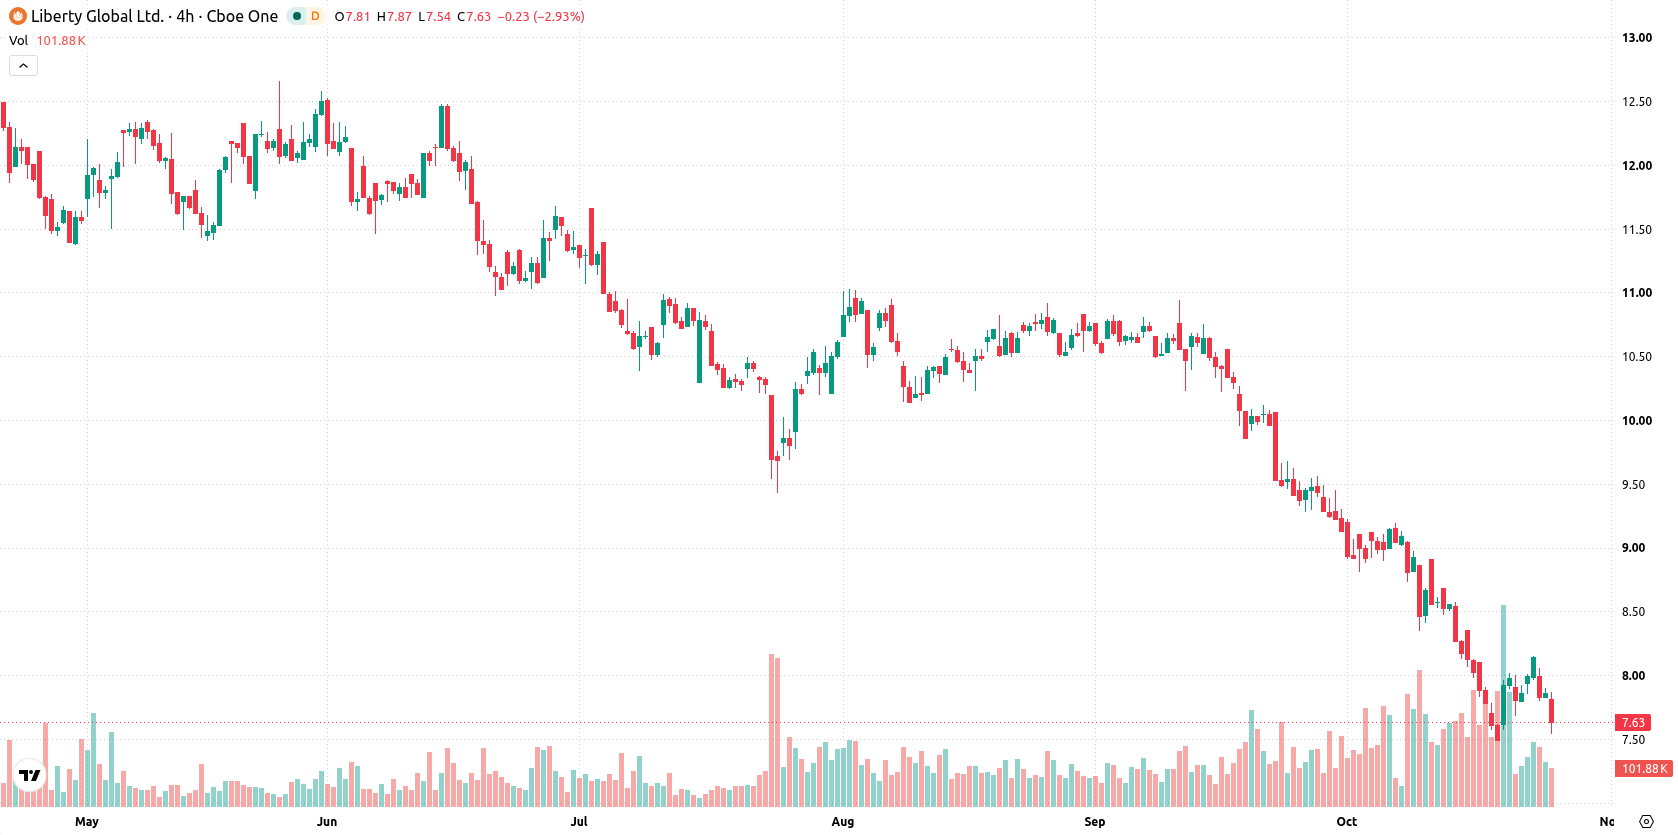
Bearish momentum and resistance persist as moving averages and signals align
Liberty Global is trading below its 20-day, 50-day, and 200-day moving averages at $8.55, $9.67, and $11.09, indicating persistent downward pressure from sellers across timeframes. The near-term ceiling is set at $7.81 and the near-term floor at $7.57, with further resistance from the Ichimoku Kijun at $8.85, all confirming a bearish trend structure. Momentum signals remain negative—MACD and ADX both show strong selling momentum, with the ADX at an elevated 52.62, signaling a trending market. RSI sits at 32.41 with a sell forecast, indicating the stock is near but not quite into technical oversold territory; CCI also reads -85.28 (sell), and Stochastic RSI is overbought at 83.96, reflecting a divergence in short-term oscillators. Bull/Bear Power (BBP) at -0.12 indicates sellers are still dominating intraday, as the stock has fallen $0.26 or 3.31% since the previous close after opening with an upside gap of roughly 1.5%. Liberty Global is trading near the session low, with intraday volatility at 3.71%. The tone remains heavy as sellers hold control, confirmed by most short-term signals despite a brief overbought reading in one oscillator.
Earlier, analysts noted that Liberty Global was entrenched in a bearish technical structure with persistent selling pressure and weak price action. The current analysis confirms the prevailing downside bias and highlights the importance of the $7.57 support level, with any sustained move below this threshold potentially accelerating the next leg lower toward the $7.32 region.










-
 Afghanistan
-
 Albania
-
 Algeria
-
 Angola
-
 Argentina
-
 Armenia
-
 Australia
-
 Austria
-
 Azerbaijan
-
 Bahamas
-
 Bahrain
-
 Bangladesh
-
 Belarus
-
 Belgium
-
 Bolivia
-
 Botswana
-
 Brazil
-
 Brunei
-
 Bulgaria
-
 Cambodia
-
 Cameroon
-
 Canada
-
 Chile
-
 China
-
 Colombia
-
 Congo
-
 Costa Rica
-
 Cote d'Ivoire
-
 Croatia
-
 Cuba
-
 Cyprus
-
 Czechia
-
 DR Congo
-
 Denmark
-
 Dominican Republic
-
 Ecuador
-
 Egypt
-
 El Salvador
-
 Estonia
-
 Eswatini
-
 Ethiopia
-
 Finland
-
 France
-
 Georgia
-
 Germany
-
 Ghana
-
 Greece
-
 Haiti
-
 Hong Kong
-
 Hungary
-
 India
-
 Indonesia
-
 Iran, Islamic republic
-
 Iraq
-
 Ireland
-
 Israel
-
 Italy
-
 Jamaica
-
 Japan
-
 Jordan
-
 Kazakhstan
-
 Kenya
-
 Korea
-
 Kuwait
-
 Kyrgyzstan
-
 Laos
-
 Latvia
-
 Lebanon
-
 Lesotho
-
 Libya
-
 Lithuania
-
 Luxembourg
-
 Madagascar
-
 Malaysia
-
 Malta
-
 Mauritius
-
 Mexico
-
 Moldova
-
 Mongolia
-
 Montenegro
-
 Morocco
-
 Mozambique
-
 Myanmar
-
 Namibia
-
 Nepal
-
 Netherlands
-
 New Zealand
-
 Nigeria
-
 North Macedonia
-
 Norway
-
 Oman
-
 Pakistan
-
 Palestine
-
 Panama
-
 Papua New Guinea
-
 Paraguay
-
 Peru
-
 Philippines
-
 Poland
-
 Portugal
-
 Puerto Rico
-
 Qatar
-
 Reunion
-
 Romania
-
 Rwanda
-
 Saudi Arabia
-
 Serbia
-
 Singapore
-
 Slovakia
-
 Slovenia
-
 Somalia
-
 South Africa
-
 Spain
-
 Sri Lanka
-
 Sweden
-
 Switzerland
-
 Syria
-
 Taiwan
-
 Tajikistan
-
 Tanzania
-
 Thailand
-
 Trinidad and Tobago
-
 Tunisia
-
 Turkey
-
 UAE
-
 Uganda
-
 Ukraine
-
 United Kingdom
-
United States
-
 Uruguay
-
 Uzbekistan
-
 Venezuela
-
 Vietnam
-
 Yemen
-
 Zambia
-
 Zimbabwe
- Forex
- Crypto












