

Anthropic and SpaceX AI chip deals: Can NVDA sustain its upward move?

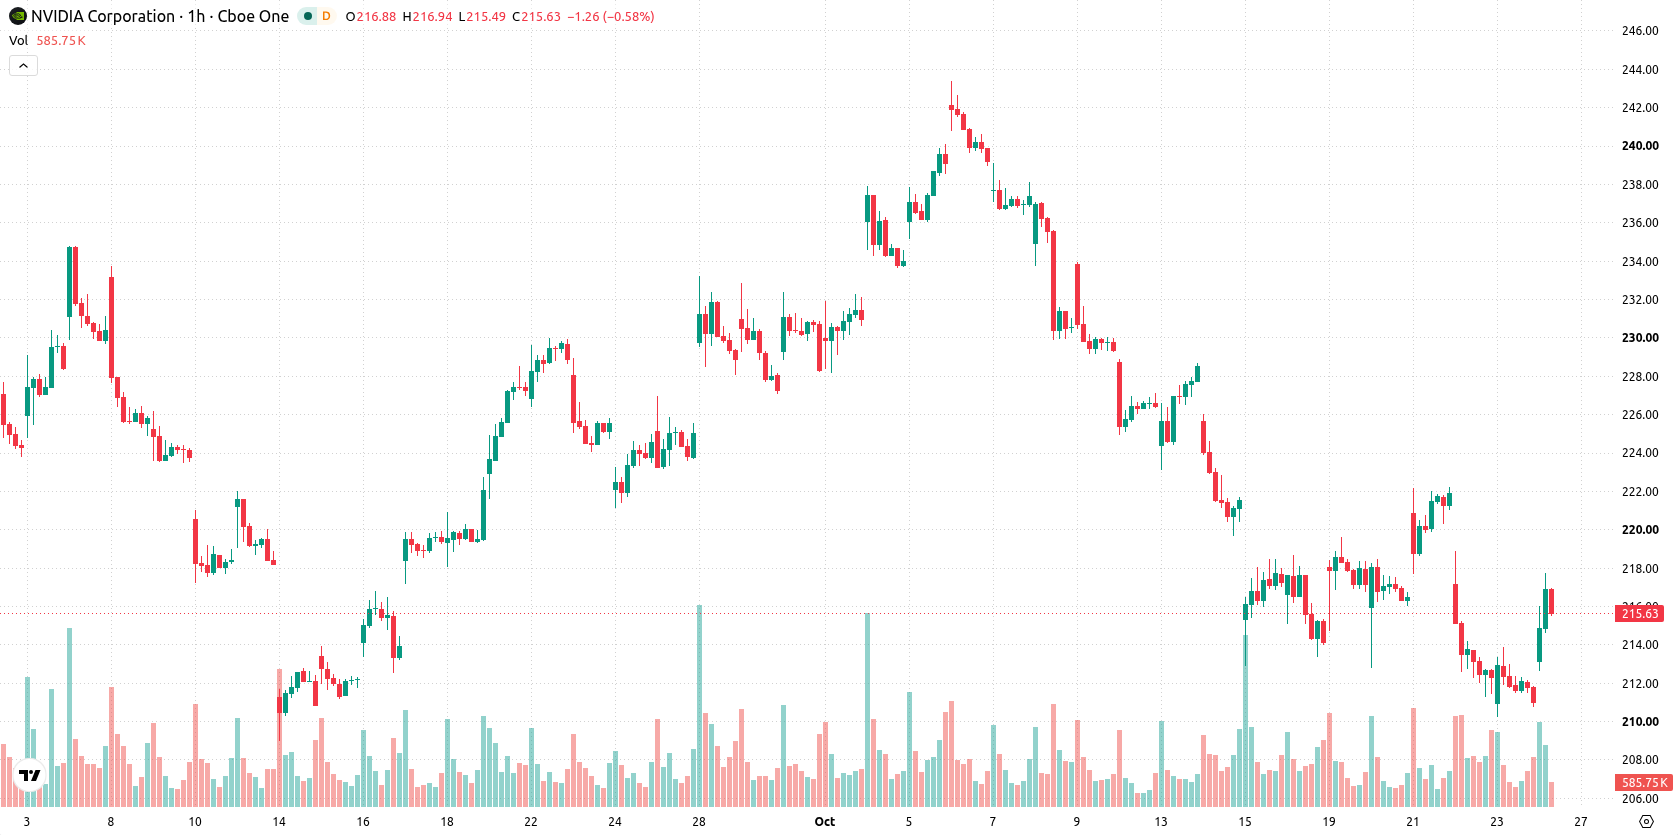
Nvidia (NVDA) stock is trading at $215.4, gaining 2.09% on the day. The price sits above its key short-term moving averages but remains just below medium-term averages, reflecting a mixed setup in the broader trend context.
 166.45
179.92
Highlights
- Fifty-seven ETFs collectively bought $295.5 million of Nvidia stock over five days, indicating substantial institutional inflows.
- Nvidia is navigating U.S. export restrictions with new funding structures backed by GPU inventory and next-generation AI chips offering higher revenue efficiency.
- Nvidia stock trades in a $210.28 to $220.52 range with short-term bullish activity amid persistently weak overall momentum signals and downside pressure.
Institutional inflows and supply chain liquidity offset China market loss
Nvidia is seeing robust institutional demand, as fifty-seven ETFs collectively purchased $295.5 million of its stock over five consecutive days, signaling a strong inflow of capital and supporting recent buying activity, according to Yahoo Finance. While the company has lost access to the China AI accelerator market due to U.S. export controls, specialist financiers are now structuring large funding facilities backed by Nvidia GPU inventory, creating new forms of liquidity and resilience in its supply chain. Nvidia's next-generation Vera Rubin chips also promise substantially higher revenue per gigawatt compared to the previous Grace Blackwell line, according to Fool, while recent large-scale hardware purchases by Anthropic and SpaceX highlight accelerating AI chip demand, as reported by Investing.com.
Divergence emerges as sellers dominate despite oversold signals
On the technical front, NVDA/USD trades above its SMA-20 but just below the SMA-50 on the hourly chart, and remains well supported above the SMA-200. The Ichimoku Kijun at $216.19 currently defines immediate resistance. Key momentum signals — including MACD, ADX, CCI, and Bull/Bear Power — show persistent seller dominance, while RSI at 31.8 and Stochastic RSI both point to oversold conditions, and the Awesome Oscillator remains neutral. This sets up a pronounced divergence between stronger price action and still-weak momentum.
Volatility bands define directional risks amid breakout potential
In the short term, NVDA is likely to remain within the $210.28 to $220.52 price corridor, reflecting typical volatility bands relative to current levels. Probability-weighted scenarios assign a 57% chance to downside movement versus 43% for an upward breakout. A close above $216.19 would shift the balance toward a bullish scenario, while any dip below $210.28 would open up increased bearish risks.
Previously it was reported that Nvidia faced persistent short- and medium-term technical headwinds despite efforts to strengthen its role in the AI hardware sector. The current analysis adds a new dimension with evidence of significant institutional inflows and evolving sources of liquidity, making the $216.19 resistance level a critical threshold for any sustained bullish reversal.













-
 Afghanistan
-
 Albania
-
 Algeria
-
 Angola
-
 Argentina
-
 Armenia
-
 Australia
-
 Austria
-
 Azerbaijan
-
 Bahamas
-
 Bahrain
-
 Bangladesh
-
 Belarus
-
 Belgium
-
 Bolivia
-
 Botswana
-
 Brazil
-
 Brunei
-
 Bulgaria
-
 Cambodia
-
 Cameroon
-
 Canada
-
 Chile
-
 China
-
 Colombia
-
 Congo
-
 Costa Rica
-
 Cote d'Ivoire
-
 Croatia
-
 Cuba
-
 Cyprus
-
 Czechia
-
 DR Congo
-
 Denmark
-
 Dominican Republic
-
 Ecuador
-
 Egypt
-
 El Salvador
-
 Estonia
-
 Eswatini
-
 Ethiopia
-
 Finland
-
 France
-
 Georgia
-
 Germany
-
 Ghana
-
 Greece
-
 Haiti
-
 Hong Kong
-
 Hungary
-
 India
-
 Indonesia
-
 Iran, Islamic republic
-
 Iraq
-
 Ireland
-
 Israel
-
 Italy
-
 Jamaica
-
 Japan
-
 Jordan
-
 Kazakhstan
-
 Kenya
-
 Korea
-
 Kuwait
-
 Kyrgyzstan
-
 Laos
-
 Latvia
-
 Lebanon
-
 Lesotho
-
 Libya
-
 Lithuania
-
 Luxembourg
-
 Madagascar
-
 Malaysia
-
 Malta
-
 Mauritius
-
 Mexico
-
 Moldova
-
 Mongolia
-
 Montenegro
-
 Morocco
-
 Mozambique
-
 Myanmar
-
 Namibia
-
 Nepal
-
 Netherlands
-
 New Zealand
-
 Nigeria
-
 North Macedonia
-
 Norway
-
 Oman
-
 Pakistan
-
 Palestine
-
 Panama
-
 Papua New Guinea
-
 Paraguay
-
 Peru
-
 Philippines
-
 Poland
-
 Portugal
-
 Puerto Rico
-
 Qatar
-
 Reunion
-
 Romania
-
 Rwanda
-
 Saudi Arabia
-
 Serbia
-
 Singapore
-
 Slovakia
-
 Slovenia
-
 Somalia
-
 South Africa
-
 Spain
-
 Sri Lanka
-
 Sweden
-
 Switzerland
-
 Syria
-
 Taiwan
-
 Tajikistan
-
 Tanzania
-
 Thailand
-
 Trinidad and Tobago
-
 Tunisia
-
 Turkey
-
 UAE
-
 Uganda
-
 Ukraine
-
 United Kingdom
-
United States
-
 Uruguay
-
 Uzbekistan
-
 Venezuela
-
 Vietnam
-
 Yemen
-
 Zambia
-
 Zimbabwe
- Forex
- Crypto












