

GameStop stock declines as downward price move persists

GameStop (GME) stock is trading at $23.95 after a daily decline of 3.56%. The stock remains below its key short- and medium-term moving averages, while still positioned above important longer-term averages.
 26.44
26.44
Highlights
- GameStop filed a Form 13D/A disclosing a change in significant shareholder ownership as of October 25.
- Regulatory filing may affect investor perceptions of control, governance, and possible future strategy for GameStop.
- GameStop shares face strong near-term selling pressure with technical indicators negative and an expected trading range of $22.95 to $24.95.
Ownership disclosure spurs governance concerns and investor repositioning
A Form 13D/A was filed for GameStop Corp. as of October 25, according to Investing.com. This regulatory filing indicates a disclosed change or update in beneficial ownership by a significant shareholder, which can reshape perceptions of control and future strategic initiatives. Such disclosures often prompt price sensitivity as investors reassess potential governance or activist involvement.
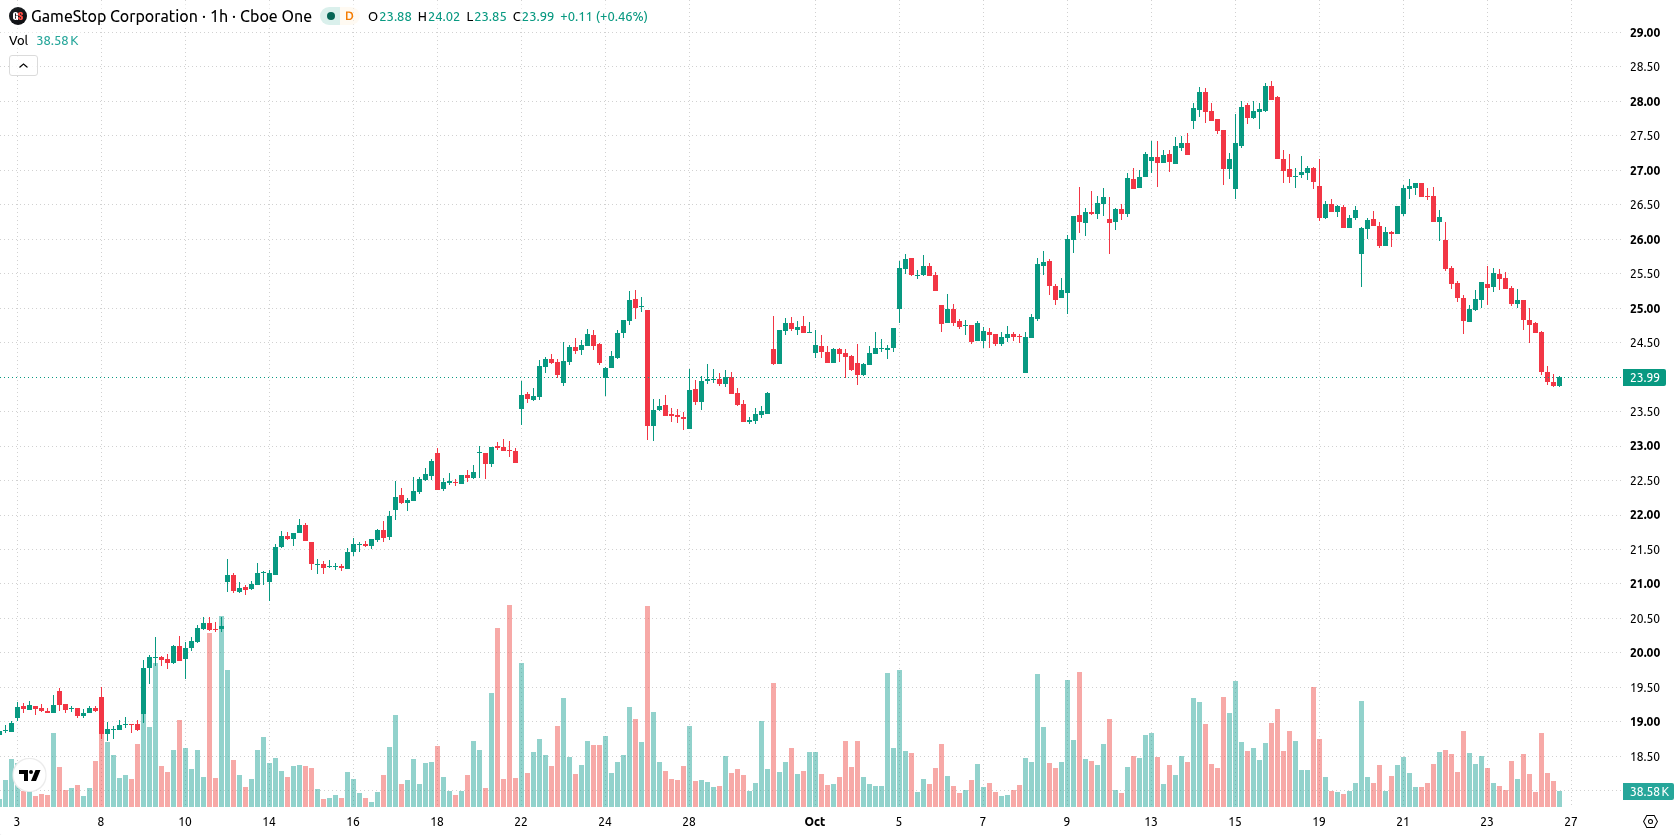
Downside momentum accelerates amid breached technical supports
On the hourly chart, GME/USD is trading below the MA-20 at $25.27 and the MA-50 at $26.18, while continuing to hold above the MA-200 at $22.62 on the daily timeframe. The Ichimoku Kijun on the daily chart is positioned at $25.37, providing immediate resistance. Intraday, a downside gap of $0.27 opened the session, contributing to the overall weakness. Technical indicators confirm the prevailing negative momentum: both MACD and ADX highlight a strong sell bias, while RSI, Stochastic RSI, and CCI all signal oversold conditions, suggesting pronounced short-term exhaustion. Bull/Bear Power remains decisively negative and the Awesome Oscillator aligns with this momentum-driven downside.
Downward bias prevails as breakout risk remains limited
Looking ahead, the expected trading range for GME over the next few days is projected at $22.95 to $24.95, reflecting a typical volatility band relative to current levels. The probability of upward movement is considered very low, with a high likelihood of continued downside unless a decisive break above the Kijun resistance at $25.37 occurs. Should the price remain range-bound, tight consolidation can be expected between these support and resistance thresholds. If support at $22.95 fails, further bearish extension is likely in the short term.
Previously it was reported that GameStop’s technical setup remained broadly bullish despite short-term selling and mixed momentum indicators. The latest regulatory filing and deepening negative momentum add urgency for traders to monitor whether the $22.95 support will hold, as a failure at this level could signal a fresh bearish phase in the short term.






Latest GameStop News




-
 Afghanistan
-
 Albania
-
 Algeria
-
 Angola
-
 Argentina
-
 Armenia
-
 Australia
-
 Austria
-
 Azerbaijan
-
 Bahamas
-
 Bahrain
-
 Bangladesh
-
 Belarus
-
 Belgium
-
 Bolivia
-
 Botswana
-
 Brazil
-
 Brunei
-
 Bulgaria
-
 Cambodia
-
 Cameroon
-
 Canada
-
 Chile
-
 China
-
 Colombia
-
 Congo
-
 Costa Rica
-
 Cote d'Ivoire
-
 Croatia
-
 Cuba
-
 Cyprus
-
 Czechia
-
 DR Congo
-
 Denmark
-
 Dominican Republic
-
 Ecuador
-
 Egypt
-
 El Salvador
-
 Estonia
-
 Eswatini
-
 Ethiopia
-
 Finland
-
 France
-
 Georgia
-
 Germany
-
 Ghana
-
 Greece
-
 Haiti
-
 Hong Kong
-
 Hungary
-
 India
-
 Indonesia
-
 Iran, Islamic republic
-
 Iraq
-
 Ireland
-
 Israel
-
 Italy
-
 Jamaica
-
 Japan
-
 Jordan
-
 Kazakhstan
-
 Kenya
-
 Korea
-
 Kuwait
-
 Kyrgyzstan
-
 Laos
-
 Latvia
-
 Lebanon
-
 Lesotho
-
 Libya
-
 Lithuania
-
 Luxembourg
-
 Madagascar
-
 Malaysia
-
 Malta
-
 Mauritius
-
 Mexico
-
 Moldova
-
 Mongolia
-
 Montenegro
-
 Morocco
-
 Mozambique
-
 Myanmar
-
 Namibia
-
 Nepal
-
 Netherlands
-
 New Zealand
-
 Nigeria
-
 North Macedonia
-
 Norway
-
 Oman
-
 Pakistan
-
 Palestine
-
 Panama
-
 Papua New Guinea
-
 Paraguay
-
 Peru
-
 Philippines
-
 Poland
-
 Portugal
-
 Puerto Rico
-
 Qatar
-
 Reunion
-
 Romania
-
 Rwanda
-
 Saudi Arabia
-
 Serbia
-
 Singapore
-
 Slovakia
-
 Slovenia
-
 Somalia
-
 South Africa
-
 Spain
-
 Sri Lanka
-
 Sweden
-
 Switzerland
-
 Syria
-
 Taiwan
-
 Tajikistan
-
 Tanzania
-
 Thailand
-
 Trinidad and Tobago
-
 Tunisia
-
 Turkey
-
 UAE
-
 Uganda
-
 Ukraine
-
 United Kingdom
-
United States
-
 Uruguay
-
 Uzbekistan
-
 Venezuela
-
 Vietnam
-
 Yemen
-
 Zambia
-
 Zimbabwe
- Forex
- Crypto












