

SNDL stock forecast: Consolidation likely with mixed momentum and volatility signals

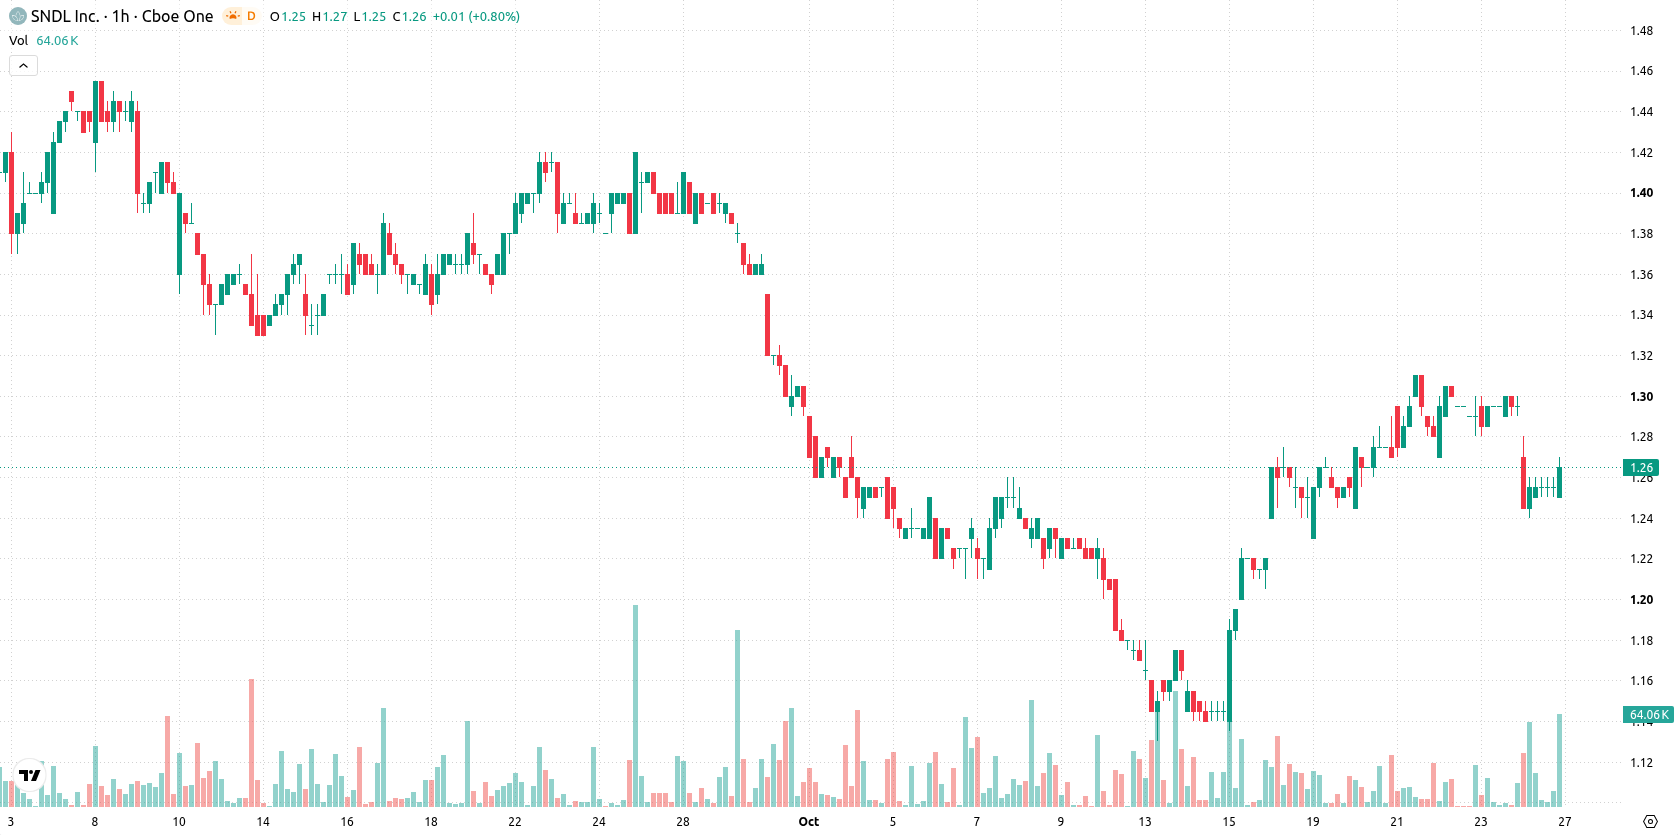
SNDL Inc. (SNDL) stock is trading at $1.27 after slipping 1.55% today. The price currently sits below its key short- and long-term moving averages, while holding above the intermediate average.
 1.30
1.34
Highlights
- SNDL stock closed at $1.27, down 1.55%, amid high volatility and mixed momentum indicators.
- Short-term signals show selling pressure while the overall momentum remains weak despite some intraday buy-side activity.
- SNDL is expected to move sideways between $1.23 and $1.31 over the next 2 to 3 days, with a slight upside probability.
Mixed momentum signals amid key technical resistance levels
Technically, SNDL closed near the day's high with high volatility. The asset currently trades below its MA-20 and MA-200, but remains above its MA-50. Immediate support is marked by the Ichimoku Kijun at $1.27. Momentum indicators paint a mixed and mostly bearish short-term outlook: both MACD and ADX continue to flash sell signals, while RSI and CCI also indicate selling conditions. Nevertheless, Stochastic RSI shows a strong buy, and Bull/Bear Power reflects intraday buy-side momentum; however, this stands in contrast to overall weak momentum and neutral confirmation from the Awesome Oscillator.
Sideways consolidation likely as price faces pivotal range
Over the next 2–3 trading days, SNDL is expected to fluctuate within the $1.23 to $1.31 range, reflecting typical volatility for the current setup. Price is likely to continue consolidating between immediate support and resistance, with a sideways scenario favored at a 55% probability. A sustained bullish reversal would require a breakout above the upper band, while renewed selling below $1.27 could open the door for further downside.
Earlier, analysts noted that SNDL was experiencing persistent selling pressure and heightened volatility ahead of its earnings report, with mixed signals from technical indicators suggesting limited directional conviction. The current analysis adds depth by highlighting continued consolidation and a mostly bearish momentum profile, indicating that a sustained move above the immediate resistance band would be required to signal any short-term bullish shift.









-
 Afghanistan
-
 Albania
-
 Algeria
-
 Angola
-
 Argentina
-
 Armenia
-
 Australia
-
 Austria
-
 Azerbaijan
-
 Bahamas
-
 Bahrain
-
 Bangladesh
-
 Belarus
-
 Belgium
-
 Bolivia
-
 Botswana
-
 Brazil
-
 Brunei
-
 Bulgaria
-
 Cambodia
-
 Cameroon
-
 Canada
-
 Chile
-
 China
-
 Colombia
-
 Congo
-
 Costa Rica
-
 Cote d'Ivoire
-
 Croatia
-
 Cuba
-
 Cyprus
-
 Czechia
-
 DR Congo
-
 Denmark
-
 Dominican Republic
-
 Ecuador
-
 Egypt
-
 El Salvador
-
 Estonia
-
 Eswatini
-
 Ethiopia
-
 Finland
-
 France
-
 Georgia
-
 Germany
-
 Ghana
-
 Greece
-
 Haiti
-
 Hong Kong
-
 Hungary
-
 India
-
 Indonesia
-
 Iran, Islamic republic
-
 Iraq
-
 Ireland
-
 Israel
-
 Italy
-
 Jamaica
-
 Japan
-
 Jordan
-
 Kazakhstan
-
 Kenya
-
 Korea
-
 Kuwait
-
 Kyrgyzstan
-
 Laos
-
 Latvia
-
 Lebanon
-
 Lesotho
-
 Libya
-
 Lithuania
-
 Luxembourg
-
 Madagascar
-
 Malaysia
-
 Malta
-
 Mauritius
-
 Mexico
-
 Moldova
-
 Mongolia
-
 Montenegro
-
 Morocco
-
 Mozambique
-
 Myanmar
-
 Namibia
-
 Nepal
-
 Netherlands
-
 New Zealand
-
 Nigeria
-
 North Macedonia
-
 Norway
-
 Oman
-
 Pakistan
-
 Palestine
-
 Panama
-
 Papua New Guinea
-
 Paraguay
-
 Peru
-
 Philippines
-
 Poland
-
 Portugal
-
 Puerto Rico
-
 Qatar
-
 Reunion
-
 Romania
-
 Rwanda
-
 Saudi Arabia
-
 Serbia
-
 Singapore
-
 Slovakia
-
 Slovenia
-
 Somalia
-
 South Africa
-
 Spain
-
 Sri Lanka
-
 Sweden
-
 Switzerland
-
 Syria
-
 Taiwan
-
 Tajikistan
-
 Tanzania
-
 Thailand
-
 Trinidad and Tobago
-
 Tunisia
-
 Turkey
-
 UAE
-
 Uganda
-
 Ukraine
-
 United Kingdom
-
United States
-
 Uruguay
-
 Uzbekistan
-
 Venezuela
-
 Vietnam
-
 Yemen
-
 Zambia
-
 Zimbabwe
- Forex
- Crypto












