

Will Texas Instruments stock break $316.56 resistance amid strong earnings and acquisition news?

Texas Instruments (TXN) stock is trading at $306.63, climbing 2.85% on the day. The stock is holding above its key moving averages, reflecting strong near-term momentum.
 304.96
312.98
Highlights
- Texas Instruments has priced $2 billion in senior unsecured notes to finance its acquisition of Silicon Laboratories.
- Third quarter revenue reached $6.06 billion with net income of $2.43 billion, and the quarterly dividend rose for the 23rd consecutive year.
- Shares of Texas Instruments trade with strong bullish momentum and are expected to consolidate in the $296.7 to $316.56 range over the next 2 to 3 days.
Debt issuance boosts acquisition strategy as earnings and dividend strengthen outlook
Texas Instruments has priced four series of senior unsecured notes totaling $2 billion to fund its planned acquisition of Silicon Laboratories, a move that injects new capital and directly supports the company's expansion strategy, according to Gurufocus. This debt issuance underscores management's intent to drive inorganic growth, which can lift demand expectations for the stock. In parallel, recently reported third quarter results showed $6.06 billion in revenue with $2.43 billion in net income, while a quarterly dividend increase for the 23rd consecutive year, as noted by Prnewswire and Yahoo Finance, continues to signal confidence in long-term shareholder returns.
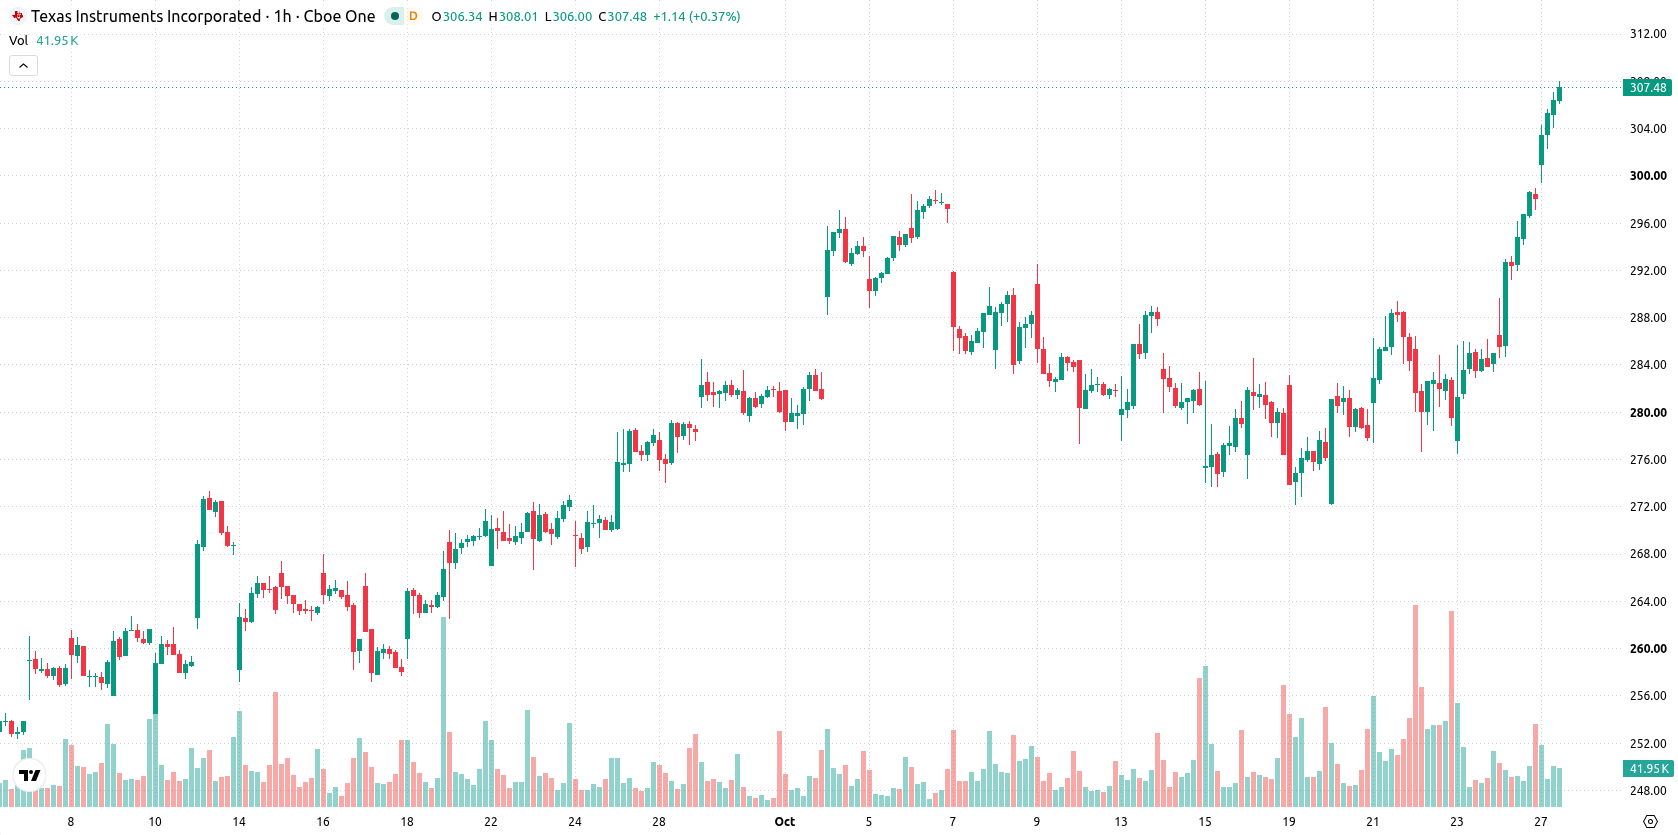
Bullish technical momentum as overbought readings warn of pullback risk
On the technical front, TXN has cleared and remains well above the MA-20 ($288.93) and MA-50 ($283.86) on the hourly chart, while also trading decisively above the MA-200 ($257.3) on the daily timeframe. The Ichimoku Kijun at $290.3 serves as immediate support. Momentum indicators reinforce bullish conditions: MACD and ADX both indicate a Buy setup, the Awesome Oscillator is bullish, and the RSI at 77.16 along with both Stochastic RSI and CCI are in overbought territory. Bull/Bear Power confirms buyers' dominance in the intraday session, although the overbought oscillator readings warn of elevated momentum and potential for near-term pullbacks.
Consolidation likely as resistance and volatility shape near-term bias
Looking ahead to the next 2–3 trading days, TXN is expected to consolidate within a typical volatility band of $296.7 to $316.56. There is a 72% probability of further upside, with a baseline outlook calling for range-bound action between these levels. A breakout above resistance near the upper boundary could trigger additional gains, while a decisive close below the Kijun and lower range may shift momentum toward a bearish scenario.
Previously it was reported that Texas Instruments’ stock was in a technical uptrend supported by a history of dividend increases and strong earnings results. The current article adds a new dimension with the company’s recent debt issuance to fund an acquisition, prompting traders to monitor the $316.56 resistance level for any further upside potential in the coming days.






Latest Texas Instruments News




-
 Afghanistan
-
 Albania
-
 Algeria
-
 Angola
-
 Argentina
-
 Armenia
-
 Australia
-
 Austria
-
 Azerbaijan
-
 Bahamas
-
 Bahrain
-
 Bangladesh
-
 Belarus
-
 Belgium
-
 Bolivia
-
 Botswana
-
 Brazil
-
 Brunei
-
 Bulgaria
-
 Cambodia
-
 Cameroon
-
 Canada
-
 Chile
-
 China
-
 Colombia
-
 Congo
-
 Costa Rica
-
 Cote d'Ivoire
-
 Croatia
-
 Cuba
-
 Cyprus
-
 Czechia
-
 DR Congo
-
 Denmark
-
 Dominican Republic
-
 Ecuador
-
 Egypt
-
 El Salvador
-
 Estonia
-
 Eswatini
-
 Ethiopia
-
 Finland
-
 France
-
 Georgia
-
 Germany
-
 Ghana
-
 Greece
-
 Haiti
-
 Hong Kong
-
 Hungary
-
 India
-
 Indonesia
-
 Iran, Islamic republic
-
 Iraq
-
 Ireland
-
 Israel
-
 Italy
-
 Jamaica
-
 Japan
-
 Jordan
-
 Kazakhstan
-
 Kenya
-
 Korea
-
 Kuwait
-
 Kyrgyzstan
-
 Laos
-
 Latvia
-
 Lebanon
-
 Lesotho
-
 Libya
-
 Lithuania
-
 Luxembourg
-
 Madagascar
-
 Malaysia
-
 Malta
-
 Mauritius
-
 Mexico
-
 Moldova
-
 Mongolia
-
 Montenegro
-
 Morocco
-
 Mozambique
-
 Myanmar
-
 Namibia
-
 Nepal
-
 Netherlands
-
 New Zealand
-
 Nigeria
-
 North Macedonia
-
 Norway
-
 Oman
-
 Pakistan
-
 Palestine
-
 Panama
-
 Papua New Guinea
-
 Paraguay
-
 Peru
-
 Philippines
-
 Poland
-
 Portugal
-
 Puerto Rico
-
 Qatar
-
 Reunion
-
 Romania
-
 Rwanda
-
 Saudi Arabia
-
 Serbia
-
 Singapore
-
 Slovakia
-
 Slovenia
-
 Somalia
-
 South Africa
-
 Spain
-
 Sri Lanka
-
 Sweden
-
 Switzerland
-
 Syria
-
 Taiwan
-
 Tajikistan
-
 Tanzania
-
 Thailand
-
 Trinidad and Tobago
-
 Tunisia
-
 Turkey
-
 UAE
-
 Uganda
-
 Ukraine
-
 United Kingdom
-
United States
-
 Uruguay
-
 Uzbekistan
-
 Venezuela
-
 Vietnam
-
 Yemen
-
 Zambia
-
 Zimbabwe
- Forex
- Crypto












