

Will ADP stock hold $277.02 support as sellers dominate the session?

Apple Inc. (ADP) stock is trading at $285, marking a daily decline of 2.77%. The price sits below its key moving averages, indicating continued downside pressure in the session.
 297.76
305.44
Highlights
- Automatic Data Processing reported fiscal Q1 2027 revenue of $5.5 billion, up 6%, and adjusted EPS of $2.82, exceeding expectations.
- The company increased its full-year adjusted EPS growth forecast to 10% to 12%, compared with the prior 9% to 11% range, after six consecutive earnings beats.
- Shares of ADP fell 2.77%, trading in the $277.02 to $292.98 range, as technical indicators confirm continued short-term bearish momentum.
Earnings beat and guidance boost fail to offset market selling
Automatic Data Processing reported fiscal Q1 2027 revenue growth of 6% to $5.5 billion and adjusted non-GAAP earnings per share of $2.82, surpassing Wall Street expectations, according to Yahoo Finance. In response to this performance, the company raised its full-year adjusted EPS growth guidance for fiscal 2027 to a new range of 10%-12%, up from its previous 9%-11%. This marked its sixth consecutive quarterly earnings beat, further reflecting resilient demand and ongoing margin expansion. While these developments typically support a stronger share price, the stock has come under broader selling pressure in today's session.
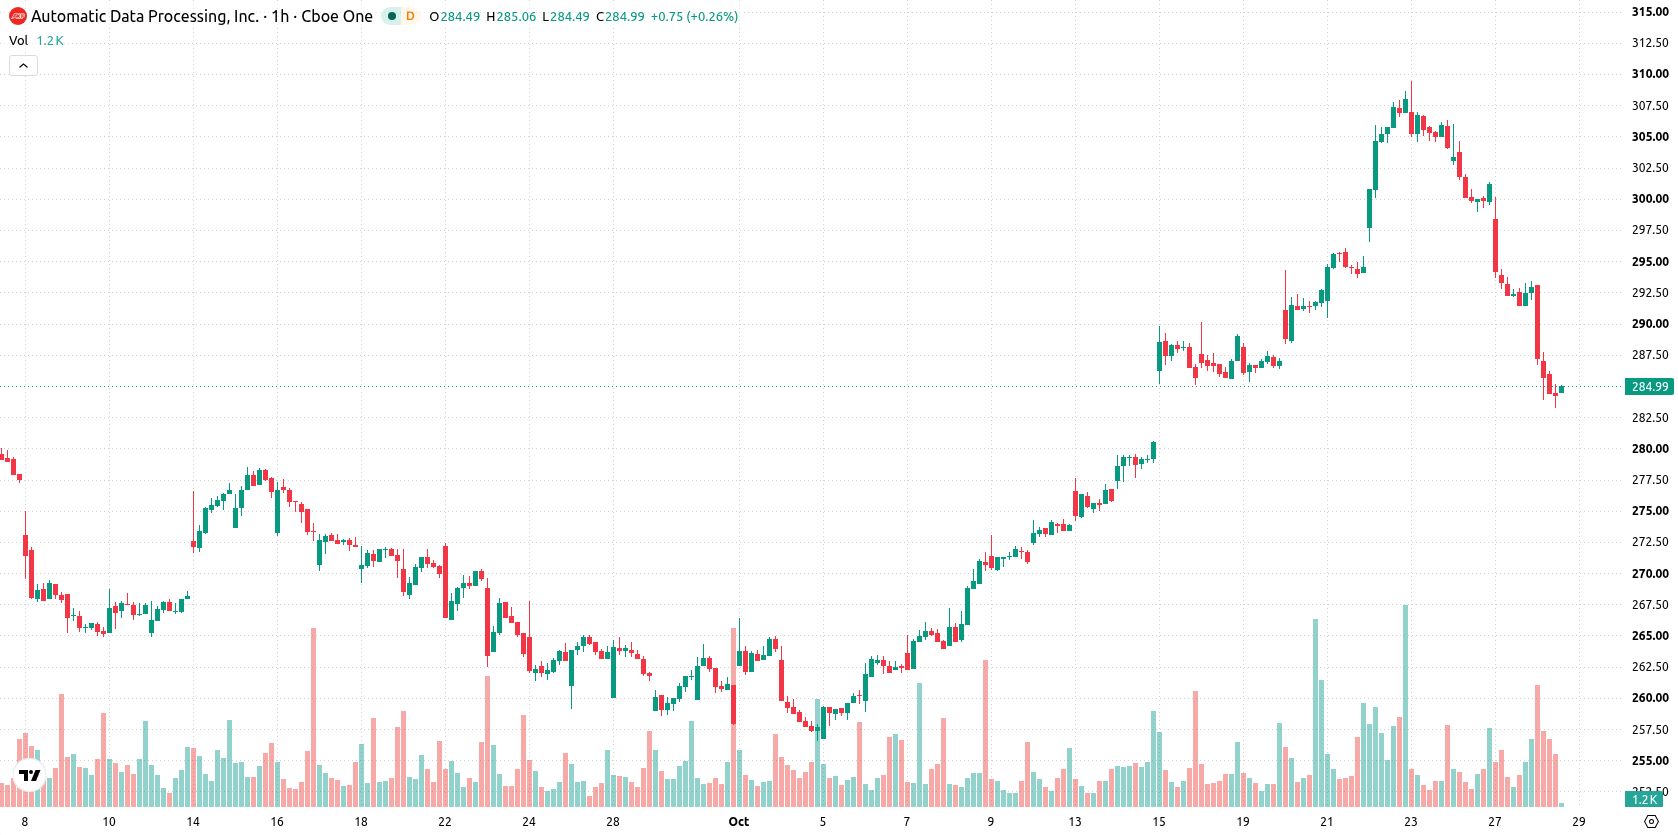
Resistance dominance amid downside signals and oversold momentum
On the hourly chart, ADP is trading below both the MA-20 at $298.46 and the MA-50 at $296.59, confirming persistent short- and medium-term resistance. The price remains above the long-term MA-200 at $239.94, indicating that the broader bullish structure is unbroken, with the Ichimoku Kijun at $298.06 acting as immediate resistance. Momentum signals, including MACD and ADX, point to a downside bias, while RSI, Stochastic RSI, CCI, and Bull/Bear Power all signal oversold conditions or strong seller dominance in the current session. The Awesome Oscillator is aligned with the day's selling momentum, and there are no signs of bullish divergence across indicators.
Breakout risk as price faces volatile consolidation zone
Over the next few days, ADP is expected to consolidate within the $277.02 to $292.98 range, reflecting typical volatility at current levels. The probability of a move higher stands at 28%, while a further decline is more likely if support near $277.02 is breached. Should the price manage to break above immediate resistance at $298.06, there is scope for an advance toward the upper boundary of the recent range. A sustained move below $277.02 would likely open the path to new short-term lows.
Previously it was reported that Fitch affirmed Automatic Data Processing’s strong credit profile, citing sustained low leverage and robust cash generation as key strengths. The current price action amid broad market pressure adds a tactical consideration for traders, with a decisive move beyond the $298.06 resistance or a breakdown below $277.02 likely to dictate the next directional leg.






Latest Automatic Data Processing News





-
 Afghanistan
-
 Albania
-
 Algeria
-
 Angola
-
 Argentina
-
 Armenia
-
 Australia
-
 Austria
-
 Azerbaijan
-
 Bahamas
-
 Bahrain
-
 Bangladesh
-
 Belarus
-
 Belgium
-
 Bolivia
-
 Botswana
-
 Brazil
-
 Brunei
-
 Bulgaria
-
 Cambodia
-
 Cameroon
-
 Canada
-
 Chile
-
 China
-
 Colombia
-
 Congo
-
 Costa Rica
-
 Cote d'Ivoire
-
 Croatia
-
 Cuba
-
 Cyprus
-
 Czechia
-
 DR Congo
-
 Denmark
-
 Dominican Republic
-
 Ecuador
-
 Egypt
-
 El Salvador
-
 Estonia
-
 Eswatini
-
 Ethiopia
-
 Finland
-
 France
-
 Georgia
-
 Germany
-
 Ghana
-
 Greece
-
 Haiti
-
 Hong Kong
-
 Hungary
-
 India
-
 Indonesia
-
 Iran, Islamic republic
-
 Iraq
-
 Ireland
-
 Israel
-
 Italy
-
 Jamaica
-
 Japan
-
 Jordan
-
 Kazakhstan
-
 Kenya
-
 Korea
-
 Kuwait
-
 Kyrgyzstan
-
 Laos
-
 Latvia
-
 Lebanon
-
 Lesotho
-
 Libya
-
 Lithuania
-
 Luxembourg
-
 Madagascar
-
 Malaysia
-
 Malta
-
 Mauritius
-
 Mexico
-
 Moldova
-
 Mongolia
-
 Montenegro
-
 Morocco
-
 Mozambique
-
 Myanmar
-
 Namibia
-
 Nepal
-
 Netherlands
-
 New Zealand
-
 Nigeria
-
 North Macedonia
-
 Norway
-
 Oman
-
 Pakistan
-
 Palestine
-
 Panama
-
 Papua New Guinea
-
 Paraguay
-
 Peru
-
 Philippines
-
 Poland
-
 Portugal
-
 Puerto Rico
-
 Qatar
-
 Reunion
-
 Romania
-
 Rwanda
-
 Saudi Arabia
-
 Serbia
-
 Singapore
-
 Slovakia
-
 Slovenia
-
 Somalia
-
 South Africa
-
 Spain
-
 Sri Lanka
-
 Sweden
-
 Switzerland
-
 Syria
-
 Taiwan
-
 Tajikistan
-
 Tanzania
-
 Thailand
-
 Trinidad and Tobago
-
 Tunisia
-
 Turkey
-
 UAE
-
 Uganda
-
 Ukraine
-
 United Kingdom
-
United States
-
 Uruguay
-
 Uzbekistan
-
 Venezuela
-
 Vietnam
-
 Yemen
-
 Zambia
-
 Zimbabwe
- Forex
- Crypto












