

Intuit stock remains in holding pattern amid new AI-driven product rollouts: weekly analysis

Shares of Intuit Inc. (INTU) are trading near $327 after slipping nearly 5% this week, with technical signals locked in a holding pattern. Conflicting momentum readings and neutral oscillators have kept the stock in a broad range, raising uncertainty as traders look for clearer direction in the days ahead.
 344.53
Highlights
- Shares of Intuit stock fell 4.89% over the past 7 days to $326.53, testing weekly lows.
- Current support stands at $325.32, with resistance at $354.89 and additional support at $310.38.
- Technical signals are mixed and rangebound, with a 63% probability of a move lower to $313.3 to $339.75 next week.
AI expansion and industry adoption drive upbeat sentiment despite mixed guidance
Intuit has expanded its artificial intelligence capabilities across QuickBooks and its accounting platforms, introducing new Intuit Intelligence features aimed at improving collaboration and automation, according to MarketScreener. Over 250,000 accounting firms have adopted the new Intuit Accountant Suite, with additional industry-specific offerings now in beta. Fiscal 2026 revenue grew 14% to $21.4 billion, and management is guiding for 9%-10% revenue growth next year.
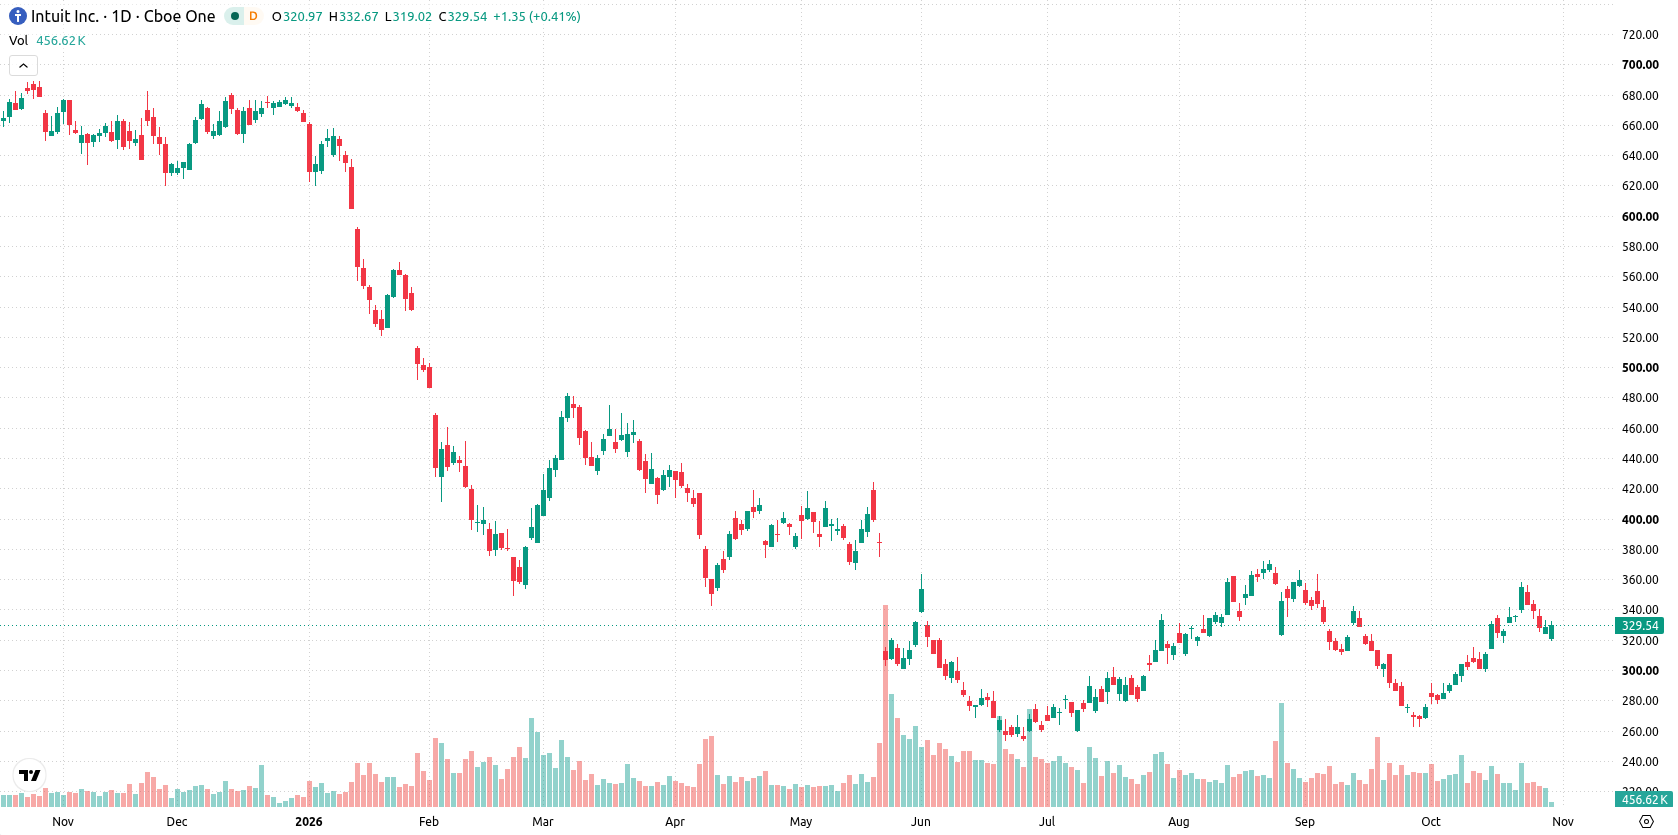
Key support retested as mixed signals and volatility cloud outlook
On the daily chart, the setup is showing signs of pressure following a sharp move lower without a sustained trend, with volatility registering at 9.09%. Momentum signals are mixed: the MACD is in buy territory with a value of 11.45, while the HMA points to a near-term sell bias. Oscillators, including the RSI and CCI, are neutral, suggesting no confirmed extreme in either direction. The nearest support is at $325.32, which price is currently testing, with resistance up at $354.89 and Ichimoku Kijun acting as additional support at $310.38.
Base case favors range-bound trade as breakout risk shapes next week
Next week, the expected trading range is $313.3 to $339.75, with a 37% probability of an increase and a 63% probability of a decrease. The base case is for the stock to remain within this bracket as traders respond to competing signals around current levels. A close above resistance at $354.89 would open the door for a recovery push, while a move below support at $325.32 could expose the stock to further downside toward the lower end of the forecast range.
Earlier, analysts noted that Intuit's short- and medium-term technical momentum remained constrained within a broad consolidation amid persistent resistance. With the stock still subject to mixed signals and elevated volatility, traders should watch for a break of either $354.89 resistance or $325.32 support as the likely catalyst for the next directional move.






Latest Intuit News




-
 Afghanistan
-
 Albania
-
 Algeria
-
 Angola
-
 Argentina
-
 Armenia
-
 Australia
-
 Austria
-
 Azerbaijan
-
 Bahamas
-
 Bahrain
-
 Bangladesh
-
 Belarus
-
 Belgium
-
 Bolivia
-
 Botswana
-
 Brazil
-
 Brunei
-
 Bulgaria
-
 Cambodia
-
 Cameroon
-
 Canada
-
 Chile
-
 China
-
 Colombia
-
 Congo
-
 Costa Rica
-
 Cote d'Ivoire
-
 Croatia
-
 Cuba
-
 Cyprus
-
 Czechia
-
 DR Congo
-
 Denmark
-
 Dominican Republic
-
 Ecuador
-
 Egypt
-
 El Salvador
-
 Estonia
-
 Eswatini
-
 Ethiopia
-
 Finland
-
 France
-
 Georgia
-
 Germany
-
 Ghana
-
 Greece
-
 Haiti
-
 Hong Kong
-
 Hungary
-
 India
-
 Indonesia
-
 Iran, Islamic republic
-
 Iraq
-
 Ireland
-
 Israel
-
 Italy
-
 Jamaica
-
 Japan
-
 Jordan
-
 Kazakhstan
-
 Kenya
-
 Korea
-
 Kuwait
-
 Kyrgyzstan
-
 Laos
-
 Latvia
-
 Lebanon
-
 Lesotho
-
 Libya
-
 Lithuania
-
 Luxembourg
-
 Madagascar
-
 Malaysia
-
 Malta
-
 Mauritius
-
 Mexico
-
 Moldova
-
 Mongolia
-
 Montenegro
-
 Morocco
-
 Mozambique
-
 Myanmar
-
 Namibia
-
 Nepal
-
 Netherlands
-
 New Zealand
-
 Nigeria
-
 North Macedonia
-
 Norway
-
 Oman
-
 Pakistan
-
 Palestine
-
 Panama
-
 Papua New Guinea
-
 Paraguay
-
 Peru
-
 Philippines
-
 Poland
-
 Portugal
-
 Puerto Rico
-
 Qatar
-
 Reunion
-
 Romania
-
 Rwanda
-
 Saudi Arabia
-
 Serbia
-
 Singapore
-
 Slovakia
-
 Slovenia
-
 Somalia
-
 South Africa
-
 Spain
-
 Sri Lanka
-
 Sweden
-
 Switzerland
-
 Syria
-
 Taiwan
-
 Tajikistan
-
 Tanzania
-
 Thailand
-
 Trinidad and Tobago
-
 Tunisia
-
 Turkey
-
 UAE
-
 Uganda
-
 Ukraine
-
 United Kingdom
-
United States
-
 Uruguay
-
 Uzbekistan
-
 Venezuela
-
 Vietnam
-
 Yemen
-
 Zambia
-
 Zimbabwe
- Forex
- Crypto












