

HUT slides nearly 7% as negative technical signals and selling momentum weigh on price

Hut 8 Corp (HUT) slumped 6.76% as firm technical selling pressure drove continued declines, with momentum indicators signaling persistent weakness and the stock remaining deeply below its moving averages. The scope and persistence of the drop are supported by negative momentum and a bearish technical structure, though oversold indicators may temper the pace of further downside.
 59.57
69.73
Highlights
- Shares of Hut 8 trade below major moving averages, indicating sustained downward pressure across all time horizons.
- Momentum indicators remain negative and suggest an oversold bias, with sellers dominating intraday trading conditions.
- Over the next five sessions, price is projected in a $56.59 to $68.16 range with over 80% probability to the downside.
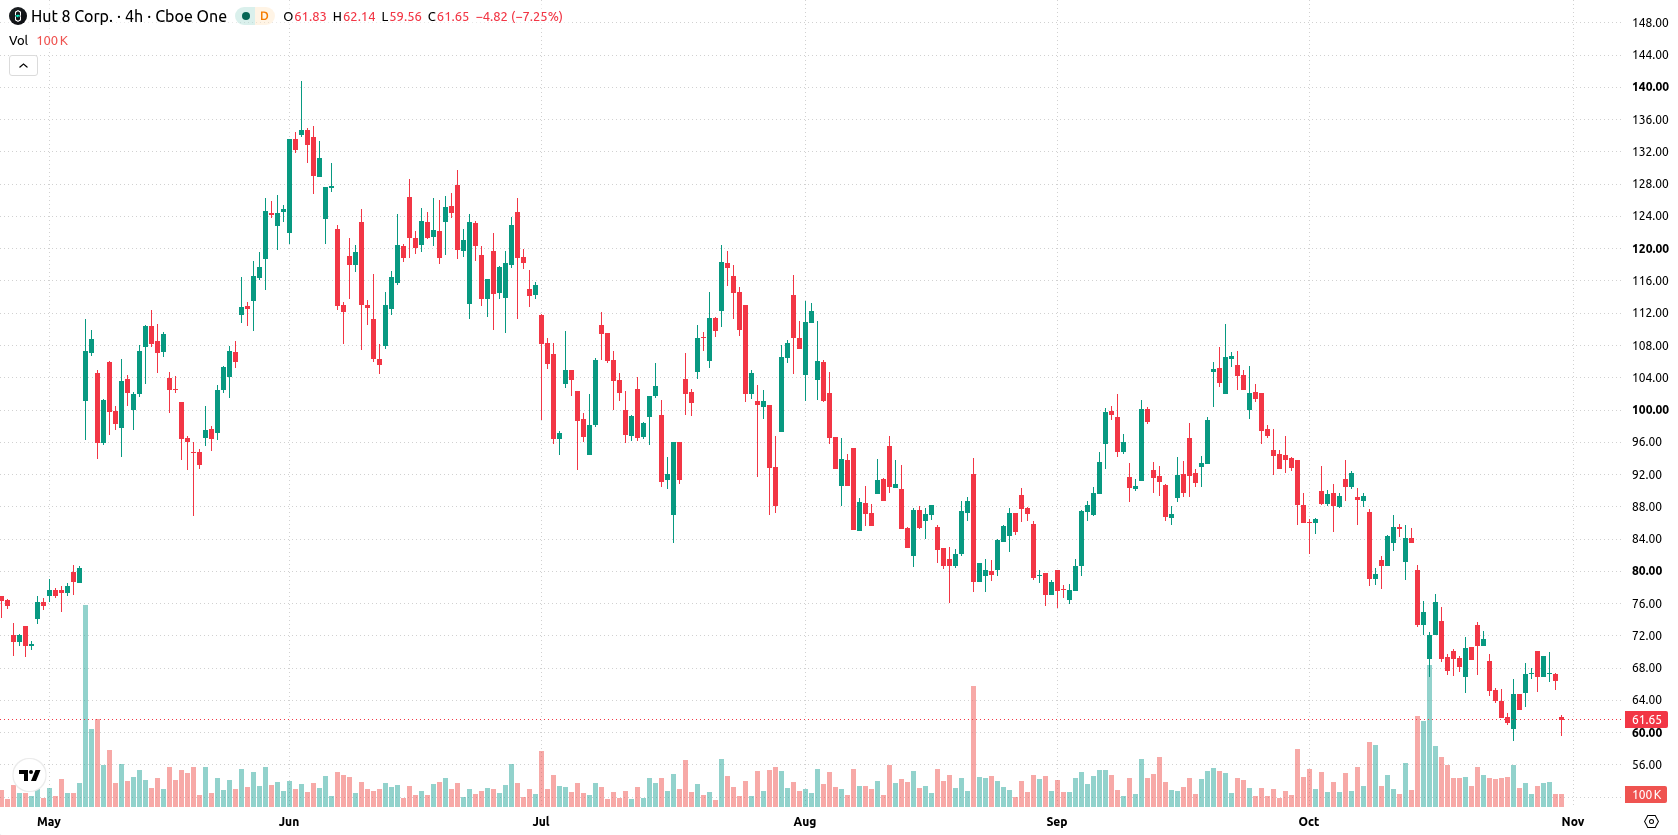
Multi-timeframe weakness as key indicators reinforce bearish momentum
Hut 8 is trading well below its 20-day, 50-day, and 200-day moving averages ($75.58, $84.54, and $82.5 respectively), highlighting sustained downward pressure across short-, medium-, and long-term horizons. The Ichimoku Kijun at $82.21 confirms resistance well above, while $65.3 marks the immediate ceiling and $59.11 the nearest floor. Momentum indicators are firmly negative: the Moving Average Convergence Divergence (MACD) and Average Directional Index (ADX) both signal continued selling pressure. The Relative Strength Index (RSI) at 38.71 and Commodity Channel Index (CCI) at -63.86 indicate an oversold bias, while Bull/Bear Power (BBP) at -0.55 confirms sellers dominate intraday momentum with an oversold forecast. The Awesome Oscillator is neutral, in line with sluggish price action. The stock is currently trading at $61.9, down $4.49 or 6.76% after opening at $67.2 following an upside gap of approximately 1.22%. Price is near the intraday low, with volatility amplitude standing at 6.78%. Intraday tone remains heavy, with consistent pressure after the open and momentum aligned with persistent selling.
Earlier, analysts noted that Hut 8 was consolidating within a volatile range as mixed technical signals suggested caution for near-term moves. The current technical setup now underscores a bearish structure with deeply oversold readings, highlighting $59.11 as a key support level that traders should monitor for potential breakdown risk in the coming sessions.











-
 Afghanistan
-
 Albania
-
 Algeria
-
 Angola
-
 Argentina
-
 Armenia
-
 Australia
-
 Austria
-
 Azerbaijan
-
 Bahamas
-
 Bahrain
-
 Bangladesh
-
 Belarus
-
 Belgium
-
 Bolivia
-
 Botswana
-
 Brazil
-
 Brunei
-
 Bulgaria
-
 Cambodia
-
 Cameroon
-
 Canada
-
 Chile
-
 China
-
 Colombia
-
 Congo
-
 Costa Rica
-
 Cote d'Ivoire
-
 Croatia
-
 Cuba
-
 Cyprus
-
 Czechia
-
 DR Congo
-
 Denmark
-
 Dominican Republic
-
 Ecuador
-
 Egypt
-
 El Salvador
-
 Estonia
-
 Eswatini
-
 Ethiopia
-
 Finland
-
 France
-
 Georgia
-
 Germany
-
 Ghana
-
 Greece
-
 Haiti
-
 Hong Kong
-
 Hungary
-
 India
-
 Indonesia
-
 Iran, Islamic republic
-
 Iraq
-
 Ireland
-
 Israel
-
 Italy
-
 Jamaica
-
 Japan
-
 Jordan
-
 Kazakhstan
-
 Kenya
-
 Korea
-
 Kuwait
-
 Kyrgyzstan
-
 Laos
-
 Latvia
-
 Lebanon
-
 Lesotho
-
 Libya
-
 Lithuania
-
 Luxembourg
-
 Madagascar
-
 Malaysia
-
 Malta
-
 Mauritius
-
 Mexico
-
 Moldova
-
 Mongolia
-
 Montenegro
-
 Morocco
-
 Mozambique
-
 Myanmar
-
 Namibia
-
 Nepal
-
 Netherlands
-
 New Zealand
-
 Nigeria
-
 North Macedonia
-
 Norway
-
 Oman
-
 Pakistan
-
 Palestine
-
 Panama
-
 Papua New Guinea
-
 Paraguay
-
 Peru
-
 Philippines
-
 Poland
-
 Portugal
-
 Puerto Rico
-
 Qatar
-
 Reunion
-
 Romania
-
 Rwanda
-
 Saudi Arabia
-
 Serbia
-
 Singapore
-
 Slovakia
-
 Slovenia
-
 Somalia
-
 South Africa
-
 Spain
-
 Sri Lanka
-
 Sweden
-
 Switzerland
-
 Syria
-
 Taiwan
-
 Tajikistan
-
 Tanzania
-
 Thailand
-
 Trinidad and Tobago
-
 Tunisia
-
 Turkey
-
 UAE
-
 Uganda
-
 Ukraine
-
 United Kingdom
-
United States
-
 Uruguay
-
 Uzbekistan
-
 Venezuela
-
 Vietnam
-
 Yemen
-
 Zambia
-
 Zimbabwe
- Forex
- Crypto












