

Will Bank of Nova Scotia stock avoid deeper losses amid weak momentum and oversold signals?

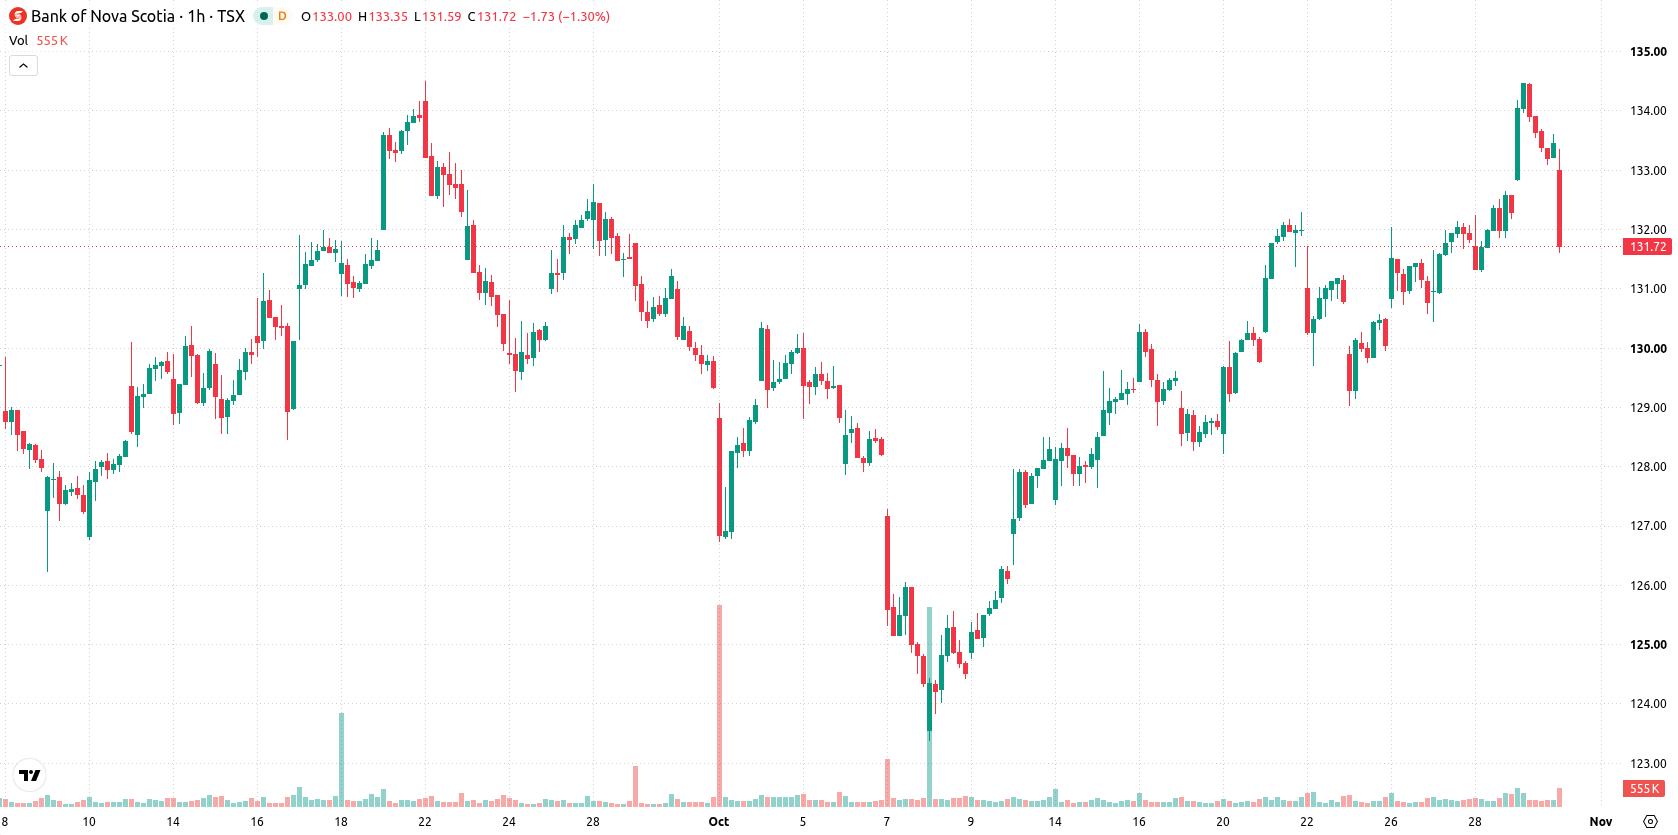
Bank of Nova Scotia (BNS) stock is trading at C$131.74 after falling 1.27% on the day. The price sits below its key short-term averages but remains above longer-term reference levels.
 132.69
133.30
Highlights
- The Federal Reserve Board approved Bank of Nova Scotia's application, representing a regulatory milestone that could affect U.S. operations and risk profile.
- Bank of Nova Scotia stock set a new 52-week high of $95.41 recently, indicating sustained investor demand before current selling pressure.
- BNS/CAD is expected to trade in a sideways range of C$129.98 to C$133.51, with short-term weakness but potential for a bullish move if resistance breaks.
Regulatory milestone shifts BNS risk profile amid investor demand
The Federal Reserve Board's approval of an application by Bank of Nova Scotia, as reported by X, represents a material regulatory milestone that could ease U.S. operating hurdles or facilitate expansion, indirectly reshaping the bank's risk profile and investor perceptions. Regulatory environment changes often alter market expectations for future growth or institutional standing, even when the approval's specifics remain undisclosed. Additionally, Bank of Nova Scotia was reported by 247wallst to have set a new 52-week high of $95.41 recently, signaling a period of sustained investor demand prior to the current session, though price action has remained under broader selling pressure.
Momentum divergence as resistance and mixed signals drive indecision
Technically, BNS is positioned just below the MA-20 at C$132.63 but remains above both MA-50 at C$131.64 and MA-200 at C$114.24. The Ichimoku Kijun level at C$132.45 acts as the next resistance. On the indicator front, the hourly MACD signals a strong buy, while the ADX remains neutral, leaving trend conviction uncertain. The RSI stands at 53.42 (Buy), Commodity Channel Index is neutral, and Stochastic RSI is oversold, highlighting potential for rebound, yet Bull/Bear Power remains oversold and the Awesome Oscillator is neutral. Divergent signals from oscillators and momentum tools point to near-term indecision, where intraday weakness contrasts with some improving momentum.
Sideways bias as volatility shapes upside and downside triggers
Looking ahead two to three sessions, BNS is projected to trade in a range of C$129.98 to C$133.51 with a 57% likelihood of an upward move based on typical volatility patterns. The baseline scenario is continued sideways trading within this band. If price surges above the Ichimoku Kijun resistance at C$132.45, the stage could be set for further gains; however, failure to hold support near the lower bound would risk increased downside pressure.
Earlier, analysts highlighted Bank of Nova Scotia's stable earnings and disciplined risk management as fundamental supports for its bullish outlook. The current mix of technical indecision and new regulatory developments introduces a pivotal period, with the C$132.45 Ichimoku Kijun level emerging as the key threshold for any renewed upside momentum.






Latest Bank of Nova Scotia News




-
 Afghanistan
-
 Albania
-
 Algeria
-
 Angola
-
 Argentina
-
 Armenia
-
 Australia
-
 Austria
-
 Azerbaijan
-
 Bahamas
-
 Bahrain
-
 Bangladesh
-
 Belarus
-
 Belgium
-
 Bolivia
-
 Botswana
-
 Brazil
-
 Brunei
-
 Bulgaria
-
 Cambodia
-
 Cameroon
-
 Canada
-
 Chile
-
 China
-
 Colombia
-
 Congo
-
 Costa Rica
-
 Cote d'Ivoire
-
 Croatia
-
 Cuba
-
 Cyprus
-
 Czechia
-
 DR Congo
-
 Denmark
-
 Dominican Republic
-
 Ecuador
-
 Egypt
-
 El Salvador
-
 Estonia
-
 Eswatini
-
 Ethiopia
-
 Finland
-
 France
-
 Georgia
-
 Germany
-
 Ghana
-
 Greece
-
 Haiti
-
 Hong Kong
-
 Hungary
-
 India
-
 Indonesia
-
 Iran, Islamic republic
-
 Iraq
-
 Ireland
-
 Israel
-
 Italy
-
 Jamaica
-
 Japan
-
 Jordan
-
 Kazakhstan
-
 Kenya
-
 Korea
-
 Kuwait
-
 Kyrgyzstan
-
 Laos
-
 Latvia
-
 Lebanon
-
 Lesotho
-
 Libya
-
 Lithuania
-
 Luxembourg
-
 Madagascar
-
 Malaysia
-
 Malta
-
 Mauritius
-
 Mexico
-
 Moldova
-
 Mongolia
-
 Montenegro
-
 Morocco
-
 Mozambique
-
 Myanmar
-
 Namibia
-
 Nepal
-
 Netherlands
-
 New Zealand
-
 Nigeria
-
 North Macedonia
-
 Norway
-
 Oman
-
 Pakistan
-
 Palestine
-
 Panama
-
 Papua New Guinea
-
 Paraguay
-
 Peru
-
 Philippines
-
 Poland
-
 Portugal
-
 Puerto Rico
-
 Qatar
-
 Reunion
-
 Romania
-
 Rwanda
-
 Saudi Arabia
-
 Serbia
-
 Singapore
-
 Slovakia
-
 Slovenia
-
 Somalia
-
 South Africa
-
 Spain
-
 Sri Lanka
-
 Sweden
-
 Switzerland
-
 Syria
-
 Taiwan
-
 Tajikistan
-
 Tanzania
-
 Thailand
-
 Trinidad and Tobago
-
 Tunisia
-
 Turkey
-
 UAE
-
 Uganda
-
 Ukraine
-
 United Kingdom
-
United States
-
 Uruguay
-
 Uzbekistan
-
 Venezuela
-
 Vietnam
-
 Yemen
-
 Zambia
-
 Zimbabwe
- Forex
- Crypto












