

Tesla stock slips as overbought conditions and weak momentum weigh on near-term outlook

Tesla (TSLA) stock is trading at $398.1, down 1.3% on the day. The price currently sits below its key short-term moving averages and remains above its medium- and long-term averages.
 363.78
414.17
Highlights
- Tesla stock saw third-quarter 2026 net earnings fall 42% to just over $800 million, reducing the near-term valuation outlook.
- Elon Musk raised the possibility of a future Tesla and SpaceX merger, but approval hurdles remain significant.
- TSLA trades under short-term technical pressure with projected 2 to 3 day range of $389.49 to $406.71 and a slight upward probability.
Net profit drop and merger speculation weigh on valuation outlook
Tesla's third-quarter 2026 earnings report, as reported by Kalkinemedia, showed that while automotive gross margin and overall gross profit improved, net earnings fell sharply by about 42% to a little over $800 million, weighing on the company’s near-term valuation outlook. Elon Musk indicated that a possible merger between Tesla and SpaceX could be pursued in the future, though this faces significant approval challenges according to 247wallst. Additional developments include the limited rollout of software update 2026.38.6 introducing security enhancements (Basenor), and a Seoul court decision clarifying Tesla’s Full Self-Driving contractual obligations while dismissing South Korean owner refund claims (Tipranks).
Mixed technical signals as strong momentum clashes with resistance
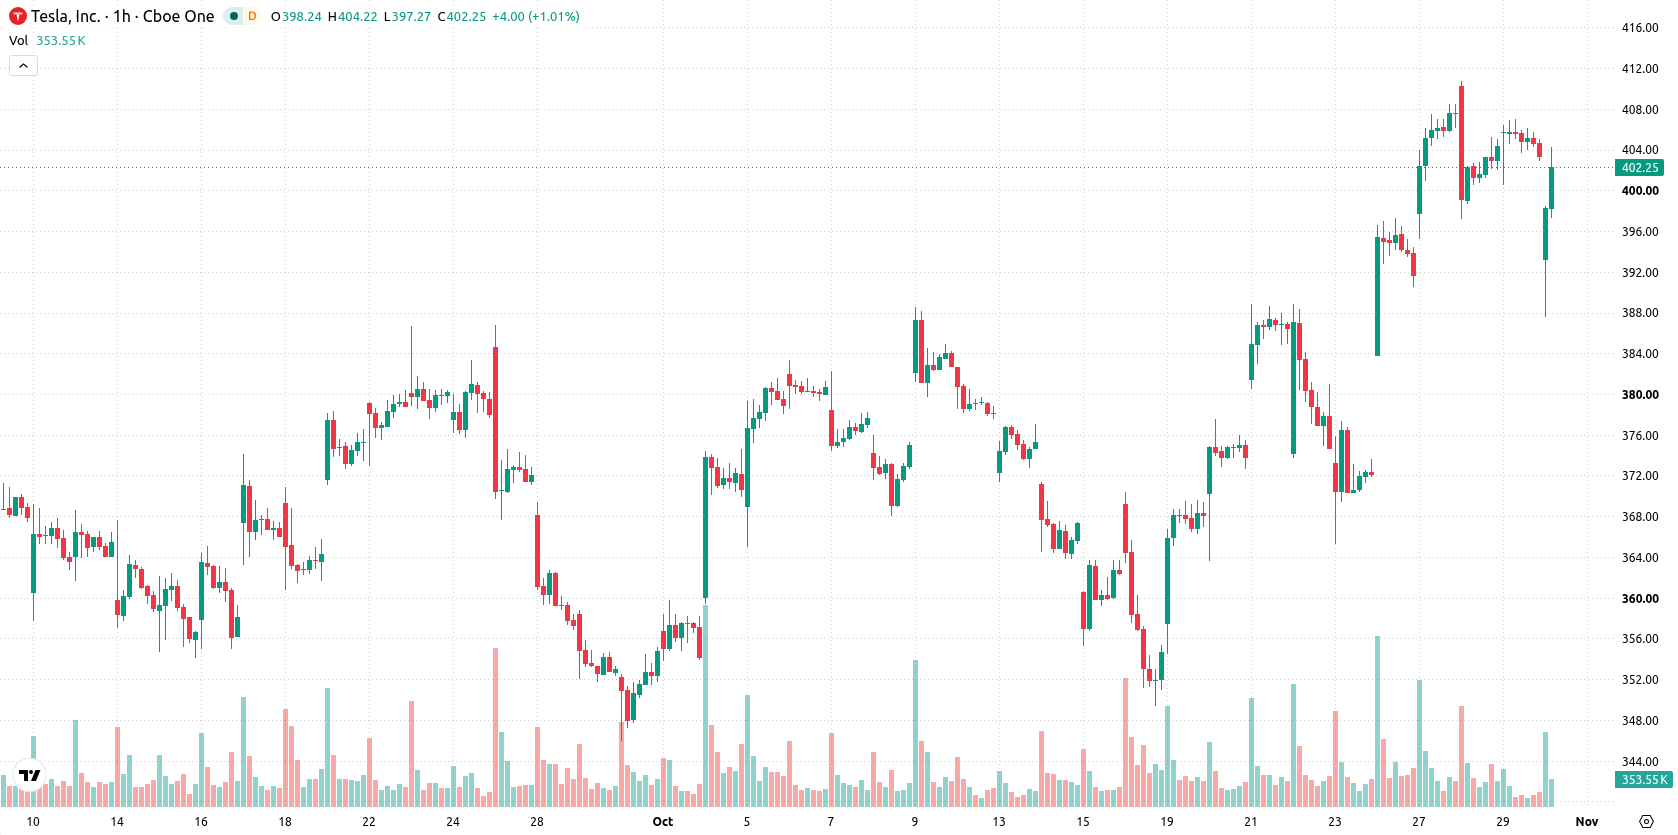
TSLA/USD is trading below the MA-20 ($404.31), but remains above the MA-50 ($392.6) on the hourly chart and MA-200 ($385.44) on the daily chart. The Ichimoku Kijun at $400.68 acts as immediate resistance. MACD indicates strong bullish momentum, while ADX signals weak selling pressure. RSI is neutral at 50.46 with a buy signal, and both Stoch RSI and CCI reflect oversold conditions. Bull/Bear Power shows continued buyer dominance in an overbought context, while the Awesome Oscillator remains neutral. Price action has slipped near today’s low on muted volatility, highlighting notable short-term divergence among signals.
Stabilization favored as breakout risks define short-term trade
Over the next 2–3 days, TSLA is expected to trade within a corridor of $389.49 to $406.71, with up probability slightly favorable at 52%. The baseline scenario calls for stabilization within this range. If price breaks above the $400.68 resistance, a rapid advance toward higher levels becomes likely. Should TSLA fail to hold support near $389.49, a reversal toward lower price levels may develop.
Earlier, analysts noted that Tesla remained highly sensitive to broader technology sector pressures, with market sentiment driving sharp reversals and elevated volatility. The current technical backdrop, featuring mixed momentum signals and diminishing selling pressure, points to a critical test of resistance at $400.68, where a sustained move above could shift the near-term trading bias to the upside.






Latest Tesla News





-
 Afghanistan
-
 Albania
-
 Algeria
-
 Angola
-
 Argentina
-
 Armenia
-
 Australia
-
 Austria
-
 Azerbaijan
-
 Bahamas
-
 Bahrain
-
 Bangladesh
-
 Belarus
-
 Belgium
-
 Bolivia
-
 Botswana
-
 Brazil
-
 Brunei
-
 Bulgaria
-
 Cambodia
-
 Cameroon
-
 Canada
-
 Chile
-
 China
-
 Colombia
-
 Congo
-
 Costa Rica
-
 Cote d'Ivoire
-
 Croatia
-
 Cuba
-
 Cyprus
-
 Czechia
-
 DR Congo
-
 Denmark
-
 Dominican Republic
-
 Ecuador
-
 Egypt
-
 El Salvador
-
 Estonia
-
 Eswatini
-
 Ethiopia
-
 Finland
-
 France
-
 Georgia
-
 Germany
-
 Ghana
-
 Greece
-
 Haiti
-
 Hong Kong
-
 Hungary
-
 India
-
 Indonesia
-
 Iran, Islamic republic
-
 Iraq
-
 Ireland
-
 Israel
-
 Italy
-
 Jamaica
-
 Japan
-
 Jordan
-
 Kazakhstan
-
 Kenya
-
 Korea
-
 Kuwait
-
 Kyrgyzstan
-
 Laos
-
 Latvia
-
 Lebanon
-
 Lesotho
-
 Libya
-
 Lithuania
-
 Luxembourg
-
 Madagascar
-
 Malaysia
-
 Malta
-
 Mauritius
-
 Mexico
-
 Moldova
-
 Mongolia
-
 Montenegro
-
 Morocco
-
 Mozambique
-
 Myanmar
-
 Namibia
-
 Nepal
-
 Netherlands
-
 New Zealand
-
 Nigeria
-
 North Macedonia
-
 Norway
-
 Oman
-
 Pakistan
-
 Palestine
-
 Panama
-
 Papua New Guinea
-
 Paraguay
-
 Peru
-
 Philippines
-
 Poland
-
 Portugal
-
 Puerto Rico
-
 Qatar
-
 Reunion
-
 Romania
-
 Rwanda
-
 Saudi Arabia
-
 Serbia
-
 Singapore
-
 Slovakia
-
 Slovenia
-
 Somalia
-
 South Africa
-
 Spain
-
 Sri Lanka
-
 Sweden
-
 Switzerland
-
 Syria
-
 Taiwan
-
 Tajikistan
-
 Tanzania
-
 Thailand
-
 Trinidad and Tobago
-
 Tunisia
-
 Turkey
-
 UAE
-
 Uganda
-
 Ukraine
-
 United Kingdom
-
United States
-
 Uruguay
-
 Uzbekistan
-
 Venezuela
-
 Vietnam
-
 Yemen
-
 Zambia
-
 Zimbabwe
- Forex
- Crypto












