

Oracle stock outlook: Downward pressure persists as support test dominates technical setup

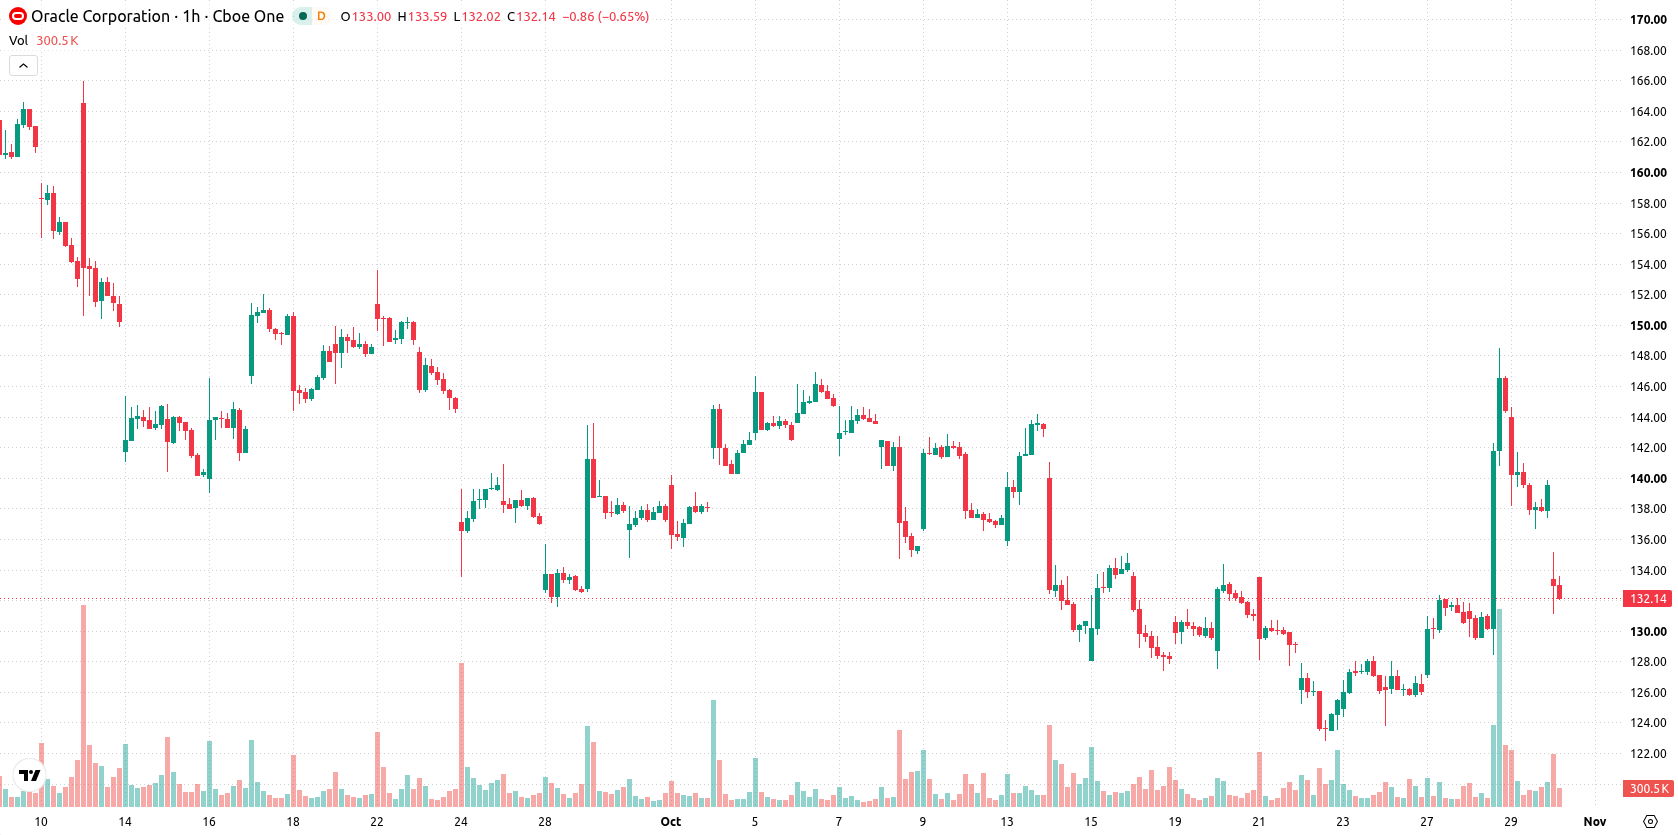
Oracle (ORCL) stock is trading at $132.69, down 4.92% on the day. The price was rejected at short-term averages and remains below longer-term levels.
 133.56
148.40
Highlights
- Oracle set a fiscal 2030 revenue target of $225 billion and limited new capital-market funding to $20 billion until then.
- The company projects free cash flow to turn positive in the second half of fiscal 2028, with capital spending peaking by fiscal 2029.
- Shares of Oracle fell 4.92% to $132.69 and may trade in a $121.72 to $143.66 range over the next 2 to 3 sessions, with technical signals mixed between consolidation and potential for a rebound.
Profitability outlook improves as capital discipline shifts sentiment
Oracle established new long-term financial targets at its Investor Day on Wednesday, outlining a fiscal 2030 revenue goal of $225 billion and a cap on additional capital-market funding at $20 billion until 2030, according to FinanceFeeds. The company also announced expectations for free cash flow to turn positive in the second half of fiscal 2028, with capital spending anticipated to peak and begin decreasing by fiscal 2029. These announcements indicate a disciplined approach to growth and capital deployment, which could improve profitability and reduce investment-related risks, though price action has remained under broader selling pressure.
Momentum signals diverge as price tests short-term support
ORCL is currently positioned below the MA-20 at $135.54 while maintaining support above the MA-50 at $130.58 on the H1 chart, and trades well below the daily MA-200 at $157.25. The Ichimoku Kijun sits at $137.07, which serves as immediate resistance. Momentum indicators present a mixed outlook: MACD shows a strong buy while ADX also signals buy, reflecting underlying strength. RSI stands at 50.74 (buy indication), Stochastic RSI is oversold, suggesting rebound potential, and CCI is neutral. Bull/Bear Power signals overbought conditions with intraday buyer dominance, whereas Awesome Oscillator remains neutral. There is clear divergence between oscillator and momentum signals, as bullish readings contrast with the intraday downward price move.
Equal upside and downside risks defined by consolidation range
Over the next two to three sessions, the expected price range for ORCL is $121.72 to $143.66, reflecting typical volatility for this stock. Upside and downside moves are equally probable, each with a 50% likelihood. The baseline scenario anticipates price consolidation within these support and resistance levels. A bullish scenario is triggered if the price breaks above $137.07, while a decline beneath support could extend losses toward the lower end of the forecasted range.
Previously it was reported that Oracle’s growth objectives and expanding technology partnerships had fueled expectations for long-term fundamental strength despite ongoing selling pressure. The current analysis adds a focus on near-term price action and volatility, highlighting $137.07 as a key resistance level that may determine the next directional move for the stock.










-
 Afghanistan
-
 Albania
-
 Algeria
-
 Angola
-
 Argentina
-
 Armenia
-
 Australia
-
 Austria
-
 Azerbaijan
-
 Bahamas
-
 Bahrain
-
 Bangladesh
-
 Belarus
-
 Belgium
-
 Bolivia
-
 Botswana
-
 Brazil
-
 Brunei
-
 Bulgaria
-
 Cambodia
-
 Cameroon
-
 Canada
-
 Chile
-
 China
-
 Colombia
-
 Congo
-
 Costa Rica
-
 Cote d'Ivoire
-
 Croatia
-
 Cuba
-
 Cyprus
-
 Czechia
-
 DR Congo
-
 Denmark
-
 Dominican Republic
-
 Ecuador
-
 Egypt
-
 El Salvador
-
 Estonia
-
 Eswatini
-
 Ethiopia
-
 Finland
-
 France
-
 Georgia
-
 Germany
-
 Ghana
-
 Greece
-
 Haiti
-
 Hong Kong
-
 Hungary
-
 India
-
 Indonesia
-
 Iran, Islamic republic
-
 Iraq
-
 Ireland
-
 Israel
-
 Italy
-
 Jamaica
-
 Japan
-
 Jordan
-
 Kazakhstan
-
 Kenya
-
 Korea
-
 Kuwait
-
 Kyrgyzstan
-
 Laos
-
 Latvia
-
 Lebanon
-
 Lesotho
-
 Libya
-
 Lithuania
-
 Luxembourg
-
 Madagascar
-
 Malaysia
-
 Malta
-
 Mauritius
-
 Mexico
-
 Moldova
-
 Mongolia
-
 Montenegro
-
 Morocco
-
 Mozambique
-
 Myanmar
-
 Namibia
-
 Nepal
-
 Netherlands
-
 New Zealand
-
 Nigeria
-
 North Macedonia
-
 Norway
-
 Oman
-
 Pakistan
-
 Palestine
-
 Panama
-
 Papua New Guinea
-
 Paraguay
-
 Peru
-
 Philippines
-
 Poland
-
 Portugal
-
 Puerto Rico
-
 Qatar
-
 Reunion
-
 Romania
-
 Rwanda
-
 Saudi Arabia
-
 Serbia
-
 Singapore
-
 Slovakia
-
 Slovenia
-
 Somalia
-
 South Africa
-
 Spain
-
 Sri Lanka
-
 Sweden
-
 Switzerland
-
 Syria
-
 Taiwan
-
 Tajikistan
-
 Tanzania
-
 Thailand
-
 Trinidad and Tobago
-
 Tunisia
-
 Turkey
-
 UAE
-
 Uganda
-
 Ukraine
-
 United Kingdom
-
United States
-
 Uruguay
-
 Uzbekistan
-
 Venezuela
-
 Vietnam
-
 Yemen
-
 Zambia
-
 Zimbabwe
- Forex
- Crypto












