

BTBT declines as downward price move continues with seller pressure in control

Bit Digital (BTBT) stock is trading at $0.83, marking a daily decline of 11.04%. The price currently sits below its key moving averages, reflecting a strong downward move for the session.
 0.8800
0.9620
Highlights
- BTBT/USD trades below key moving averages, confirming short-term, medium-term, and long-term bearish momentum.
- Momentum indicators give persistent bearish and oversold readings, with strong selling pressure dominating intraday action.
- Expected range for the next 2 to 3 days is $0.76 to $0.9, with further downside seen much more likely than recovery.
Momentum weakens as multiple signals confirm bearish dominance
On the hourly chart, BTBT trades below both its MA-20 ($0.92) and MA-50 ($0.9), with the daily price well below the longer-term MA-200 at $1.63. The Ichimoku Kijun level near $0.9 acts as immediate resistance. RSI is at 36.84 (Sell), MACD is Neutral, and ADX signals Sell. Both Stoch RSI and CCI show oversold conditions, intraday Bull/Bear Power confirms seller dominance, and the Awesome Oscillator also indicates strong selling pressure.
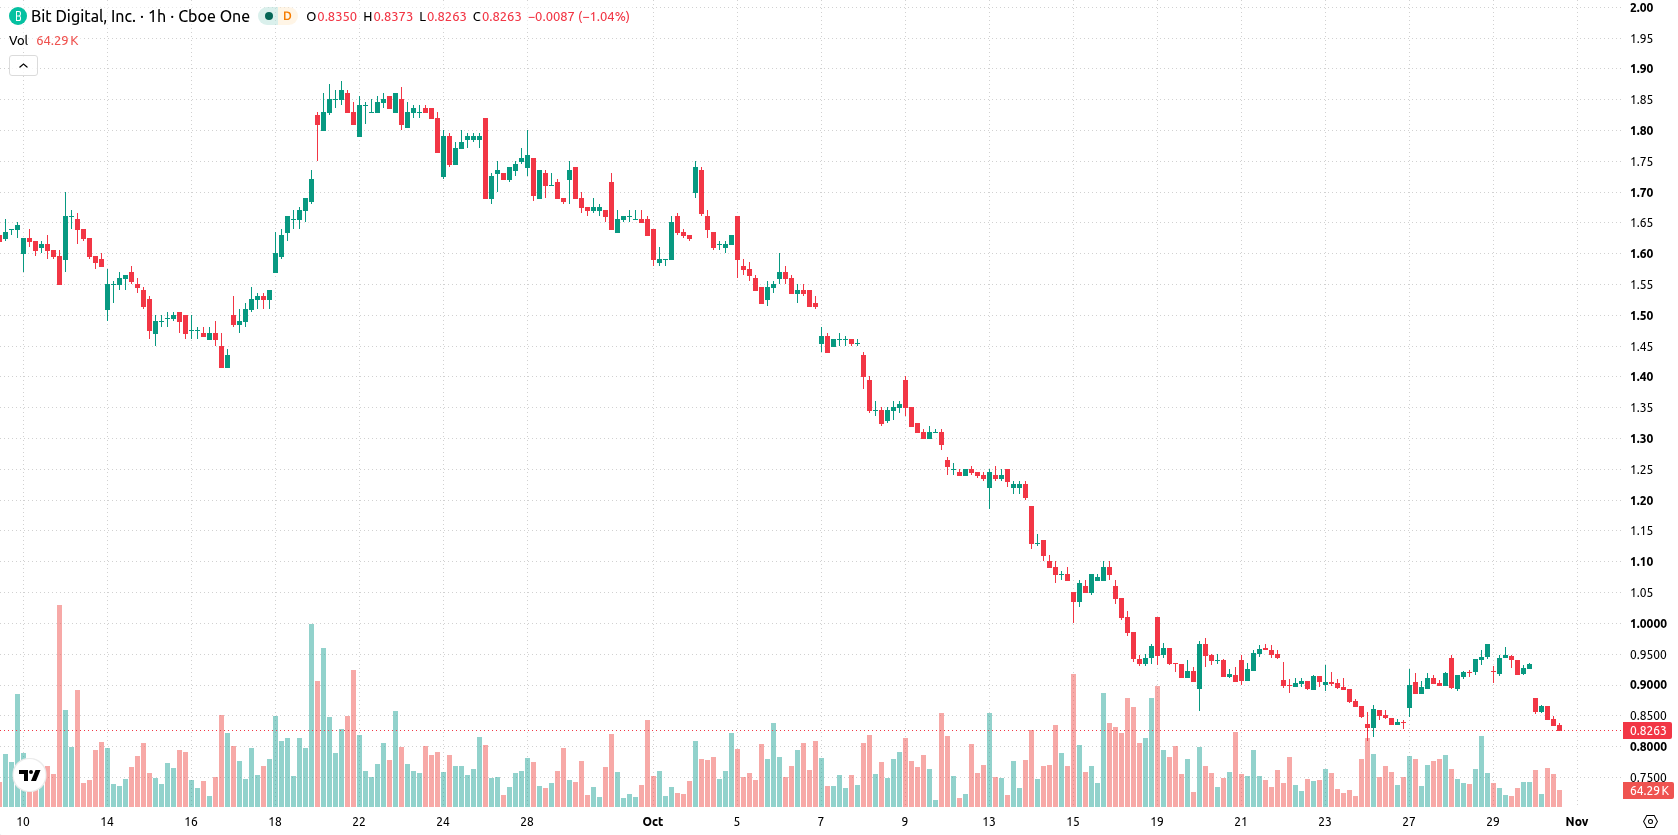
Downside risk prevails amid limited rebound prospects
Over the next 2–3 trading days, BTBT is expected to trade within a volatility band ranging from $0.76 to $0.9. The likelihood of a sustained recovery is very low, with further downside remaining a high-probability scenario. A sideways move between these levels is the baseline expectation, while a break below $0.76 would extend the current downtrend and a move above $0.9 would be needed to shift momentum toward the upside.
Previously it was reported that Bit Digital's price structure remained under bearish pressure, with technical indicators signaling ongoing downside risk. The latest decline below key moving averages reinforces the prevailing negative momentum, and traders should watch for potential volatility between $0.76 and $0.90 as a break of either boundary could determine the next directional move.






Latest Bit Digital News



-
 Afghanistan
-
 Albania
-
 Algeria
-
 Angola
-
 Argentina
-
 Armenia
-
 Australia
-
 Austria
-
 Azerbaijan
-
 Bahamas
-
 Bahrain
-
 Bangladesh
-
 Belarus
-
 Belgium
-
 Bolivia
-
 Botswana
-
 Brazil
-
 Brunei
-
 Bulgaria
-
 Cambodia
-
 Cameroon
-
 Canada
-
 Chile
-
 China
-
 Colombia
-
 Congo
-
 Costa Rica
-
 Cote d'Ivoire
-
 Croatia
-
 Cuba
-
 Cyprus
-
 Czechia
-
 DR Congo
-
 Denmark
-
 Dominican Republic
-
 Ecuador
-
 Egypt
-
 El Salvador
-
 Estonia
-
 Eswatini
-
 Ethiopia
-
 Finland
-
 France
-
 Georgia
-
 Germany
-
 Ghana
-
 Greece
-
 Haiti
-
 Hong Kong
-
 Hungary
-
 India
-
 Indonesia
-
 Iran, Islamic republic
-
 Iraq
-
 Ireland
-
 Israel
-
 Italy
-
 Jamaica
-
 Japan
-
 Jordan
-
 Kazakhstan
-
 Kenya
-
 Korea
-
 Kuwait
-
 Kyrgyzstan
-
 Laos
-
 Latvia
-
 Lebanon
-
 Lesotho
-
 Libya
-
 Lithuania
-
 Luxembourg
-
 Madagascar
-
 Malaysia
-
 Malta
-
 Mauritius
-
 Mexico
-
 Moldova
-
 Mongolia
-
 Montenegro
-
 Morocco
-
 Mozambique
-
 Myanmar
-
 Namibia
-
 Nepal
-
 Netherlands
-
 New Zealand
-
 Nigeria
-
 North Macedonia
-
 Norway
-
 Oman
-
 Pakistan
-
 Palestine
-
 Panama
-
 Papua New Guinea
-
 Paraguay
-
 Peru
-
 Philippines
-
 Poland
-
 Portugal
-
 Puerto Rico
-
 Qatar
-
 Reunion
-
 Romania
-
 Rwanda
-
 Saudi Arabia
-
 Serbia
-
 Singapore
-
 Slovakia
-
 Slovenia
-
 Somalia
-
 South Africa
-
 Spain
-
 Sri Lanka
-
 Sweden
-
 Switzerland
-
 Syria
-
 Taiwan
-
 Tajikistan
-
 Tanzania
-
 Thailand
-
 Trinidad and Tobago
-
 Tunisia
-
 Turkey
-
 UAE
-
 Uganda
-
 Ukraine
-
 United Kingdom
-
United States
-
 Uruguay
-
 Uzbekistan
-
 Venezuela
-
 Vietnam
-
 Yemen
-
 Zambia
-
 Zimbabwe
- Forex
- Crypto












