

NEM climbs nearly 4% after record earnings and robust shareholder returns

Newmont Corporation (NEM) climbed 3.81% on record third-quarter earnings and continued institutional buying interest. The rebound looks limited, as the stock remains below its 20-day, 50-day, and 200-day moving averages, signaling ongoing seller pressure across all timeframes.
 122.90
Highlights
- Newmont reported record adjusted third-quarter earnings and reaffirmed 2026 gold production guidance at 5.26 million ounces.
- The company holds $8.8 billion in cash and $12.8 billion in liquidity, distributing $1.9 billion to shareholders since the last call.
- Shares of Newmont trade below key moving averages amid negative momentum readings, with a forecast five-day range of $104.92 to $115.39.
Record earnings drive inflows as liquidity and guidance fuel investor optimism
Newmont reported record adjusted third-quarter earnings and maintained its 2026 gold production guidance at 5.26 million ounces. The company finished September with $8.8 billion in cash and $12.8 billion in total liquidity, distributing $1.9 billion to shareholders through dividends and buybacks since the last earnings call. Several institutional investors, including Summit Global Investments and One Way Holdings LLC, acquired sizable new positions, and the board declared a quarterly dividend of $0.26 per share, payable December 21, 2025. Growth projects at Tanami and Red Chris remain on track, with a final investment decision for the Block Cave project at Red Chris expected in early 2027.
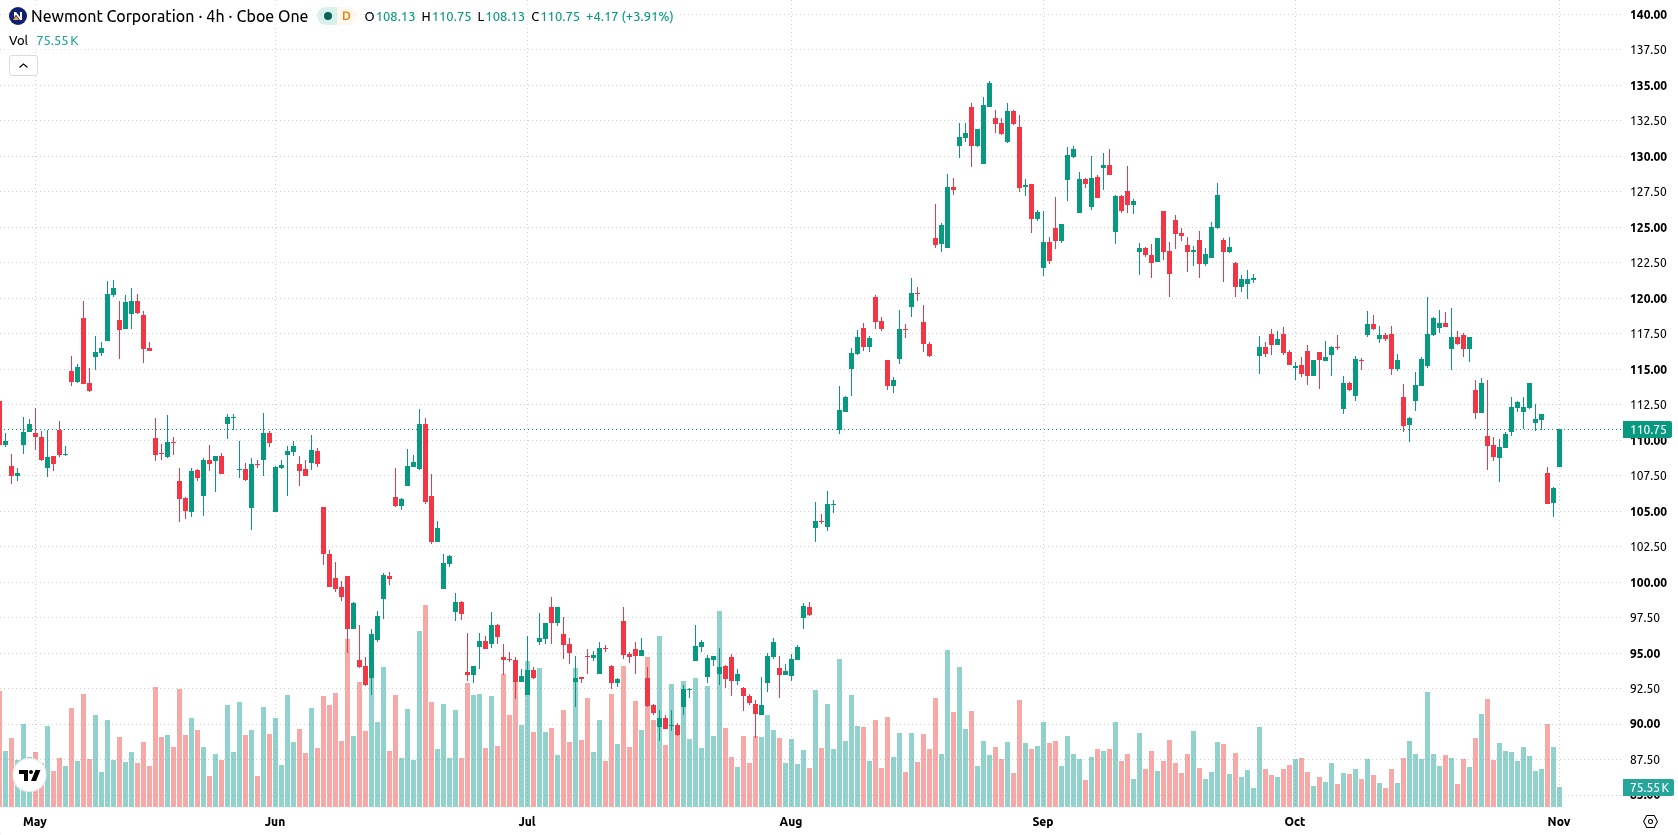
Oversold technicals highlight weak momentum despite intraday recovery attempt
Newmont is trading below its 20-day, 50-day, and 200-day moving averages ($114.39, $120.63, and $112.44 respectively), which signals sustained seller pressure in the short, medium, and long term. The nearest resistance is at $112.44 and the immediate support is near the current high at $108, with the longer-term MA-50 alignment indicating a bullish structure despite present weakness. Momentum readings remain negative as both the Moving Average Convergence Divergence (MACD) and Average Directional Index (ADX) signal a lack of bullish momentum and trend strength. The Relative Strength Index (RSI) is low at 36.19, while Stochastic RSI is at 0, both in oversold territory; the Commodity Channel Index (CCI) also shows deeply oversold conditions. Bull/Bear Power (BBP) at -4.83 indicates sellers dominate intraday momentum, reinforcing the oversold setup. Newmont is up $4.06 or 3.81%, opening with an upside gap of $0.68 (0.64%), and is trading near today’s high, with intraday volatility at 3.33%. There is strength toward session highs after the open, yet this intraday recovery is in direct contrast to weak momentum signals, highlighting a possible short-term bounce within an overall negative bias.
Earlier, analysts noted that Newmont benefited from strong gold prices, which helped offset declining production and supported robust earnings. The current technical setup now underscores the importance of watching the $108 support level, as a decisive move below it could increase the risk of a test toward the lower end of the forecast range.






Latest Newmont Corporation News



-
 Afghanistan
-
 Albania
-
 Algeria
-
 Angola
-
 Argentina
-
 Armenia
-
 Australia
-
 Austria
-
 Azerbaijan
-
 Bahamas
-
 Bahrain
-
 Bangladesh
-
 Belarus
-
 Belgium
-
 Bolivia
-
 Botswana
-
 Brazil
-
 Brunei
-
 Bulgaria
-
 Cambodia
-
 Cameroon
-
 Canada
-
 Chile
-
 China
-
 Colombia
-
 Congo
-
 Costa Rica
-
 Cote d'Ivoire
-
 Croatia
-
 Cuba
-
 Cyprus
-
 Czechia
-
 DR Congo
-
 Denmark
-
 Dominican Republic
-
 Ecuador
-
 Egypt
-
 El Salvador
-
 Estonia
-
 Eswatini
-
 Ethiopia
-
 Finland
-
 France
-
 Georgia
-
 Germany
-
 Ghana
-
 Greece
-
 Haiti
-
 Hong Kong
-
 Hungary
-
 India
-
 Indonesia
-
 Iran, Islamic republic
-
 Iraq
-
 Ireland
-
 Israel
-
 Italy
-
 Jamaica
-
 Japan
-
 Jordan
-
 Kazakhstan
-
 Kenya
-
 Korea
-
 Kuwait
-
 Kyrgyzstan
-
 Laos
-
 Latvia
-
 Lebanon
-
 Lesotho
-
 Libya
-
 Lithuania
-
 Luxembourg
-
 Madagascar
-
 Malaysia
-
 Malta
-
 Mauritius
-
 Mexico
-
 Moldova
-
 Mongolia
-
 Montenegro
-
 Morocco
-
 Mozambique
-
 Myanmar
-
 Namibia
-
 Nepal
-
 Netherlands
-
 New Zealand
-
 Nigeria
-
 North Macedonia
-
 Norway
-
 Oman
-
 Pakistan
-
 Palestine
-
 Panama
-
 Papua New Guinea
-
 Paraguay
-
 Peru
-
 Philippines
-
 Poland
-
 Portugal
-
 Puerto Rico
-
 Qatar
-
 Reunion
-
 Romania
-
 Rwanda
-
 Saudi Arabia
-
 Serbia
-
 Singapore
-
 Slovakia
-
 Slovenia
-
 Somalia
-
 South Africa
-
 Spain
-
 Sri Lanka
-
 Sweden
-
 Switzerland
-
 Syria
-
 Taiwan
-
 Tajikistan
-
 Tanzania
-
 Thailand
-
 Trinidad and Tobago
-
 Tunisia
-
 Turkey
-
 UAE
-
 Uganda
-
 Ukraine
-
 United Kingdom
-
United States
-
 Uruguay
-
 Uzbekistan
-
 Venezuela
-
 Vietnam
-
 Yemen
-
 Zambia
-
 Zimbabwe
- Forex
- Crypto












