

S&P 500 index moves higher despite weak momentum and continued seller dominance

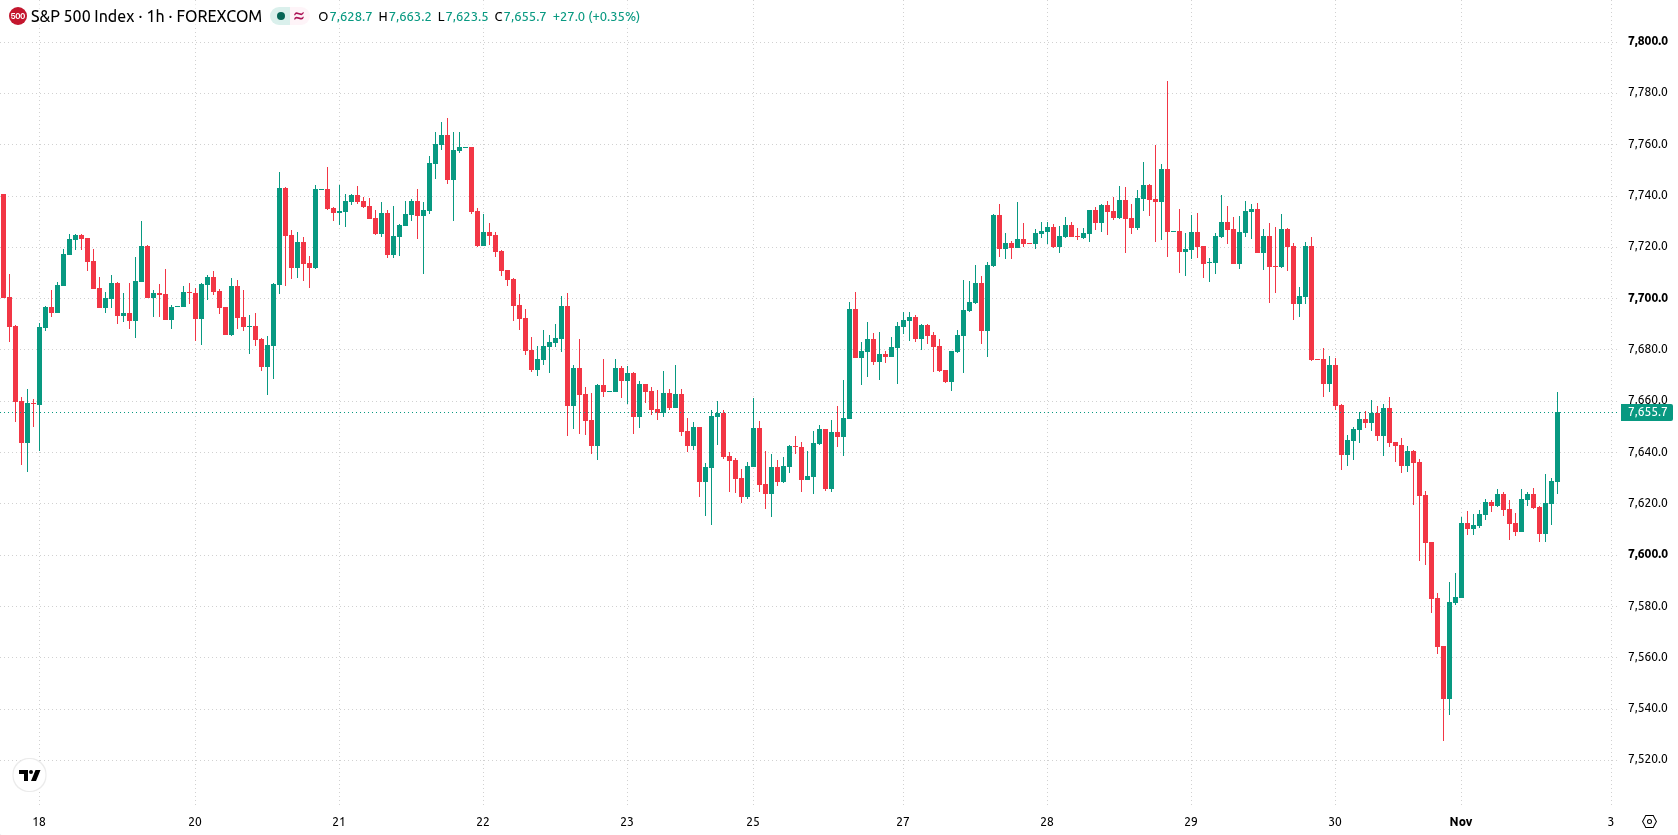
S&P 500 (SPX) is trading at 7,660, posting a daily gain of 1.32%. The index sits below its short- and medium-term moving averages, while remaining above its long-term trend line.
 7662.23
7756.77
Highlights
- Okta will enter the S&P 500, replacing Kenvue before the market opens on November 4 due to Kimberly-Clark acquiring Kenvue.
- This index change triggers passive fund reallocations, introducing buying pressure for Okta shares and reducing exposure to Kenvue.
- S&P 500 trades below key short- and medium-term averages with weak momentum, expected to consolidate between 7,603 and 7,711.
Rebalancing drives Okta inflows and Kenvue outflows amid S&P reshuffle
Okta will join the S&P 500, replacing Kenvue prior to the market open on November 4, as a result of Kimberly-Clark’s planned acquisition of Kenvue, according to Newsquawk. This index rebalancing prompts reallocation among passive funds and index-tracking portfolios, adding mechanical demand for Okta shares while driving outflows from Kenvue. The event sparks liquidity adjustments and short-term flows, contributing to heightened activity within the S&P 500’s constituent structure.
Oversold signals and intraday sell bias as support holds above MA-200
SPX trades below the hourly MA-20 at 7,673 and MA-50 at 7,676, but remains above the MA-200 at 7,309. The Ichimoku Kijun on the daily chart stands at 7,643, acting as immediate support. Momentum indicators including the MACD, ADX, and Awesome Oscillator signal a sell bias, while the RSI at 33.25, along with the CCI and Bull/Bear Power, register in oversold territory. Stochastic RSI appears neutral, and Bull/Bear Power readings confirm seller dominance on an intraday basis.
Consolidation expected as breakout risk favors downside
Over the next 2–3 trading days, SPX is expected to consolidate within a typical volatility band between 7,603 and 7,711. The probability of an upward breakout is currently 41%, while the likelihood of a downward move stands at 59%. The baseline scenario anticipates sideways action, though a bullish setup would require a sustained move above resistance, while a breach below support at the Kijun or range lows would trigger a bearish path.
In a recent review, analysts noted that U.S. equities showed tentative signs of stabilization following October's turbulence, with technology shares rebounding and key economic and political events on the horizon. The current consolidation in the S&P 500 amid mechanical index rebalancing and persistent sell signals introduces new technical and structural factors, making the 7,603–7,711 range and Kijun support level pivotal for short-term directional moves.






Latest S&P 500 News




-
 Afghanistan
-
 Albania
-
 Algeria
-
 Angola
-
 Argentina
-
 Armenia
-
 Australia
-
 Austria
-
 Azerbaijan
-
 Bahamas
-
 Bahrain
-
 Bangladesh
-
 Belarus
-
 Belgium
-
 Bolivia
-
 Botswana
-
 Brazil
-
 Brunei
-
 Bulgaria
-
 Cambodia
-
 Cameroon
-
 Canada
-
 Chile
-
 China
-
 Colombia
-
 Congo
-
 Costa Rica
-
 Cote d'Ivoire
-
 Croatia
-
 Cuba
-
 Cyprus
-
 Czechia
-
 DR Congo
-
 Denmark
-
 Dominican Republic
-
 Ecuador
-
 Egypt
-
 El Salvador
-
 Estonia
-
 Eswatini
-
 Ethiopia
-
 Finland
-
 France
-
 Georgia
-
 Germany
-
 Ghana
-
 Greece
-
 Haiti
-
 Hong Kong
-
 Hungary
-
 India
-
 Indonesia
-
 Iran, Islamic republic
-
 Iraq
-
 Ireland
-
 Israel
-
 Italy
-
 Jamaica
-
 Japan
-
 Jordan
-
 Kazakhstan
-
 Kenya
-
 Korea
-
 Kuwait
-
 Kyrgyzstan
-
 Laos
-
 Latvia
-
 Lebanon
-
 Lesotho
-
 Libya
-
 Lithuania
-
 Luxembourg
-
 Madagascar
-
 Malaysia
-
 Malta
-
 Mauritius
-
 Mexico
-
 Moldova
-
 Mongolia
-
 Montenegro
-
 Morocco
-
 Mozambique
-
 Myanmar
-
 Namibia
-
 Nepal
-
 Netherlands
-
 New Zealand
-
 Nigeria
-
 North Macedonia
-
 Norway
-
 Oman
-
 Pakistan
-
 Palestine
-
 Panama
-
 Papua New Guinea
-
 Paraguay
-
 Peru
-
 Philippines
-
 Poland
-
 Portugal
-
 Puerto Rico
-
 Qatar
-
 Reunion
-
 Romania
-
 Rwanda
-
 Saudi Arabia
-
 Serbia
-
 Singapore
-
 Slovakia
-
 Slovenia
-
 Somalia
-
 South Africa
-
 Spain
-
 Sri Lanka
-
 Sweden
-
 Switzerland
-
 Syria
-
 Taiwan
-
 Tajikistan
-
 Tanzania
-
 Thailand
-
 Trinidad and Tobago
-
 Tunisia
-
 Turkey
-
 UAE
-
 Uganda
-
 Ukraine
-
 United Kingdom
-
United States
-
 Uruguay
-
 Uzbekistan
-
 Venezuela
-
 Vietnam
-
 Yemen
-
 Zambia
-
 Zimbabwe
- Forex
- Crypto












