

Interactive Brokers stock price prediction: Oversold RSI points to possible reversal setup

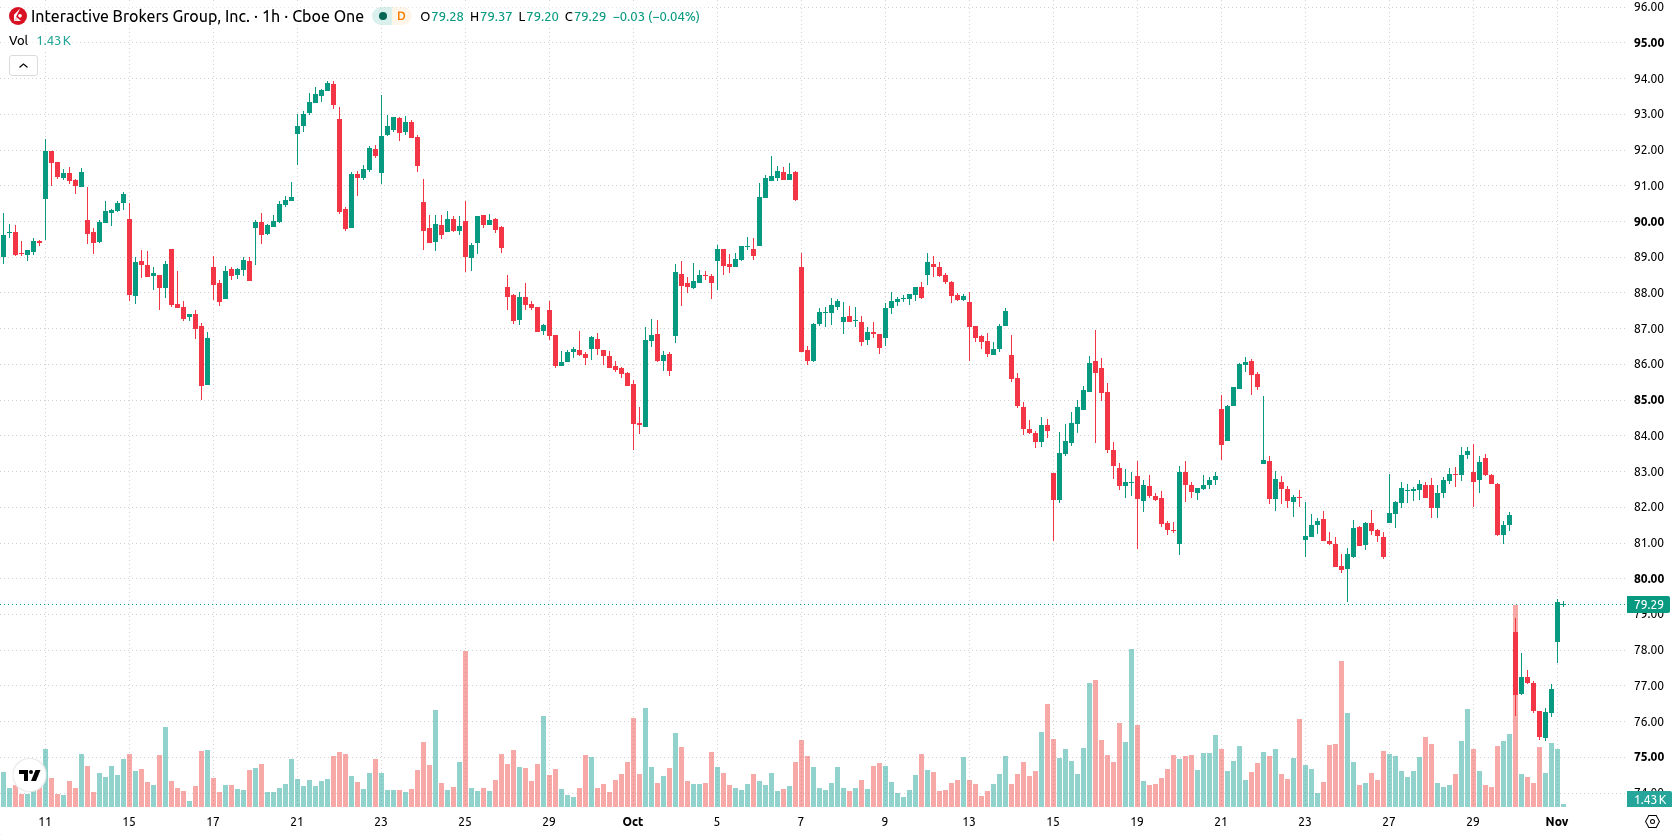
Interactive Brokers (IBKR) stock is trading at $79.07 after rising 2.92% on the day. The price remains below its key moving averages, indicating that despite today's gain, the broader technical posture has yet to turn supportive.
 79.61
83.62
Highlights
- Interactive Brokers Group made IBKR Autonomous Trading available, letting eligible clients use AI platforms to execute trades via natural language instructions.
- This technological addition is designed to increase client engagement and attract more users by simplifying access to global markets.
- Shares of Interactive Brokers closed at $79.07, remaining under key resistance, with most technical indicators signaling short- and medium-term selling pressure and a projected 70% probability of moving toward the $74.82 to $82.73 range in the next 2 to 3 days.
AI-driven trading product aims to boost user adoption
Interactive Brokers Group has advanced its technological edge by launching IBKR Autonomous Trading, a product allowing eligible clients to leverage AI platforms to identify and execute trades using natural language instructions, according to Simplywall. This expansion of its product suite is likely to increase client engagement and attract greater user adoption by simplifying access to global markets. The move underscores Interactive Brokers' continued strategy of incorporating innovative technologies to differentiate their platform from competitors.
Seller dominance and weak momentum as technical barriers persist
IBKR is currently trading below both the MA-20 at $80.51 and the MA-50 at $81.32 on the hourly chart, signaling that short- and medium-term momentum remains weak. The price has also failed to reclaim the long-term MA-200 at $82.98, while the Ichimoku Kijun level at $79.6 serves as immediate resistance. Momentum indicators reinforce this negative bias: MACD, ADX, and Awesome Oscillator all signal ongoing seller pressure; RSI sits at 32.93 (Sell); CCI also points to selling conditions; while Bull/Bear Power indicates clear dominance by sellers in an oversold environment. Stoch RSI currently reads Neutral, suggesting the pace of decline could pause, but does not yet support a reversal.
Downside risk prevails as price consolidates within range
In the near term, IBKR is expected to consolidate within a volatility band between $74.82 and $82.73 over the next two to three trading days. With the probability of an upward move calculated at 30%, the downside scenario remains more likely at 70%. For a bullish read, IBKR would need to break decisively above the $79.6 resistance, while further weakness will be confirmed on a move below $74.82 support.
Previously it was reported that Interactive Brokers' stock continued to face technical weakness even as it introduced its new AI-driven trading platform. The present analysis reinforces this outlook, with persistent downside momentum dominating and $79.6 emerging as a key resistance level to watch for any potential shift in trend.






Latest Interactive Brokers News




-
 Afghanistan
-
 Albania
-
 Algeria
-
 Angola
-
 Argentina
-
 Armenia
-
 Australia
-
 Austria
-
 Azerbaijan
-
 Bahamas
-
 Bahrain
-
 Bangladesh
-
 Belarus
-
 Belgium
-
 Bolivia
-
 Botswana
-
 Brazil
-
 Brunei
-
 Bulgaria
-
 Cambodia
-
 Cameroon
-
 Canada
-
 Chile
-
 China
-
 Colombia
-
 Congo
-
 Costa Rica
-
 Cote d'Ivoire
-
 Croatia
-
 Cuba
-
 Cyprus
-
 Czechia
-
 DR Congo
-
 Denmark
-
 Dominican Republic
-
 Ecuador
-
 Egypt
-
 El Salvador
-
 Estonia
-
 Eswatini
-
 Ethiopia
-
 Finland
-
 France
-
 Georgia
-
 Germany
-
 Ghana
-
 Greece
-
 Haiti
-
 Hong Kong
-
 Hungary
-
 India
-
 Indonesia
-
 Iran, Islamic republic
-
 Iraq
-
 Ireland
-
 Israel
-
 Italy
-
 Jamaica
-
 Japan
-
 Jordan
-
 Kazakhstan
-
 Kenya
-
 Korea
-
 Kuwait
-
 Kyrgyzstan
-
 Laos
-
 Latvia
-
 Lebanon
-
 Lesotho
-
 Libya
-
 Lithuania
-
 Luxembourg
-
 Madagascar
-
 Malaysia
-
 Malta
-
 Mauritius
-
 Mexico
-
 Moldova
-
 Mongolia
-
 Montenegro
-
 Morocco
-
 Mozambique
-
 Myanmar
-
 Namibia
-
 Nepal
-
 Netherlands
-
 New Zealand
-
 Nigeria
-
 North Macedonia
-
 Norway
-
 Oman
-
 Pakistan
-
 Palestine
-
 Panama
-
 Papua New Guinea
-
 Paraguay
-
 Peru
-
 Philippines
-
 Poland
-
 Portugal
-
 Puerto Rico
-
 Qatar
-
 Reunion
-
 Romania
-
 Rwanda
-
 Saudi Arabia
-
 Serbia
-
 Singapore
-
 Slovakia
-
 Slovenia
-
 Somalia
-
 South Africa
-
 Spain
-
 Sri Lanka
-
 Sweden
-
 Switzerland
-
 Syria
-
 Taiwan
-
 Tajikistan
-
 Tanzania
-
 Thailand
-
 Trinidad and Tobago
-
 Tunisia
-
 Turkey
-
 UAE
-
 Uganda
-
 Ukraine
-
 United Kingdom
-
United States
-
 Uruguay
-
 Uzbekistan
-
 Venezuela
-
 Vietnam
-
 Yemen
-
 Zambia
-
 Zimbabwe
- Forex
- Crypto












