

MSTR rises as upward price move extends above long-term support

Strategy (MSTR, formerly MicroStrategy) stock is trading at $134.76, a gain of 3.57% for the session and closing near the high of today’s range. The move leaves the stock below its short- and medium-term moving averages, but slightly above long-term support levels.
 137.30
144.69
Highlights
- Strategy Inc. acquired 811 Bitcoin for $65.5 million, funding the purchase by selling 1,178,552 MSTR shares.
- The company added $98.5 million to USD cash reserves and repurchased $208.2 million in STRC preferred shares, reducing future obligations.
- MSTR stock faces short- and medium-term selling pressure within a $125.98 to $143.54 range, with momentum signals remaining negative.
Expanded crypto exposure as balance sheet actions drive investor appeal
Strategy Inc. has strengthened its balance sheet and digital asset exposure by acquiring 811 Bitcoin for $65.5 million, funding this purchase through the sale of 1,178,552 MSTR shares in an at-the-market offering, according to Cryptonomist. This transaction ties the company’s asset base more closely to Bitcoin price movement and increases its attractiveness to investors seeking crypto exposure via equities. In addition, a further $98.5 million was allocated to USD cash reserves, while the recent $208.2 million buyback of STRC preferred shares reduces potential future obligations and signals a more efficient capital structure. The remaining $748.6 million buyback authorization keeps the door open for further preferred stock repurchases going forward.
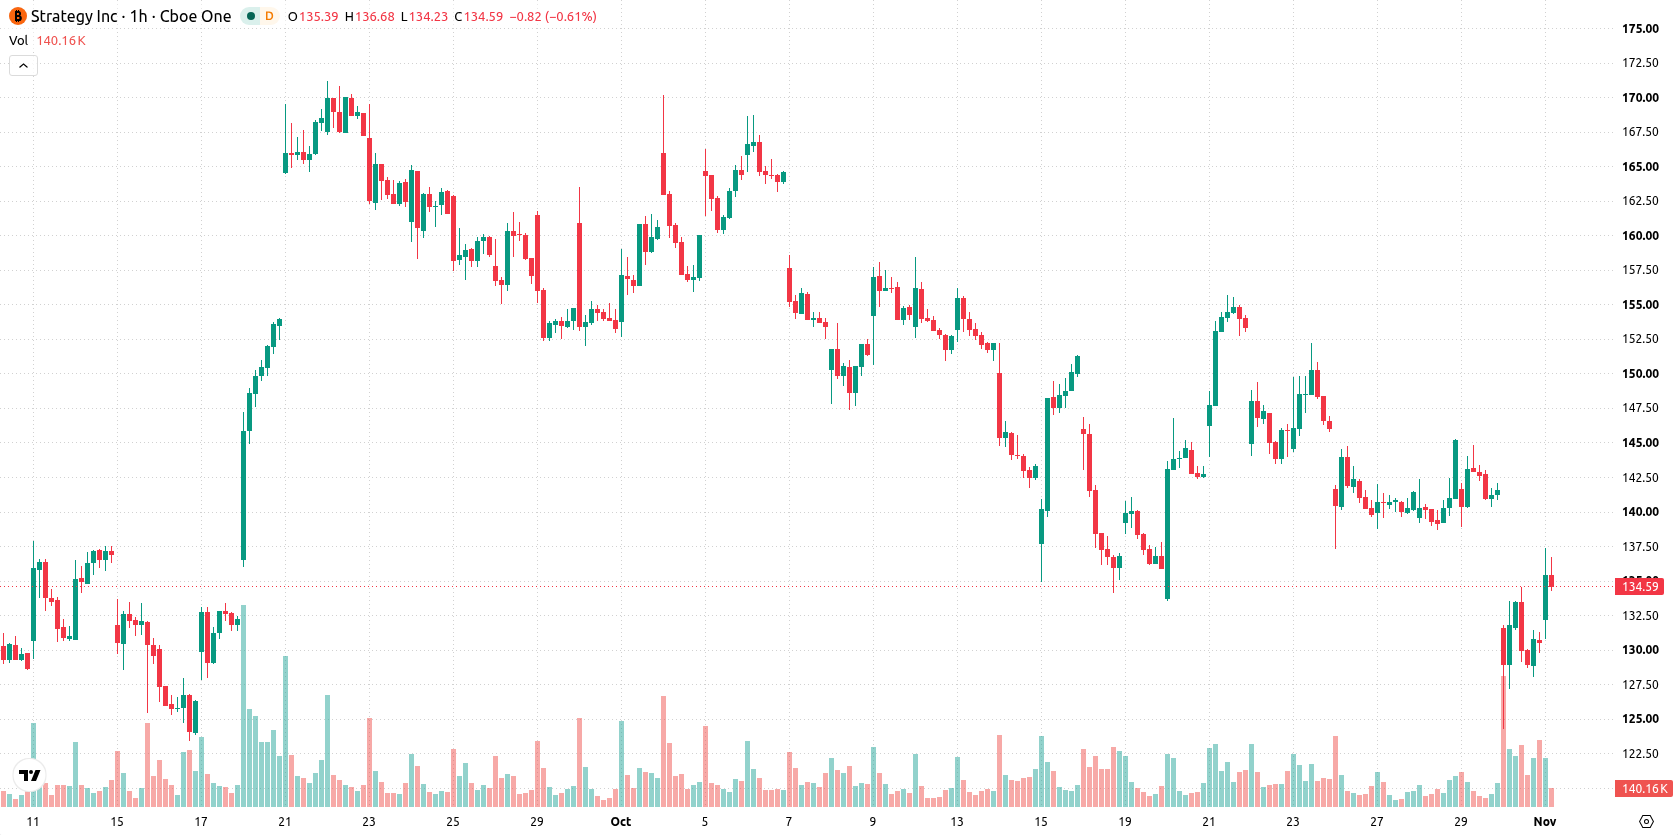
Near-term resistance and weak momentum signal downside pressure
On the H1 chart, MSTR is trading below the MA-20 at $137.62 and the MA-50 at $141.55, highlighting short- and medium-term resistance levels. The daily chart shows that the price sits just above the MA-200 at $134.55, with immediate resistance defined by the Ichimoku Kijun at $134.77. Momentum indicators remain broadly weak: both MACD and ADX are on Sell signals, while RSI registers at 36.33 (Sell) and CCI also suggests further downside risk. Stochastic RSI is Neutral, and Bull/Bear Power points to seller dominance with its Oversold reading intraday. The Awesome Oscillator is Neutral, reflecting a lack of clear trend confirmation.
Downward risk dominates as price range contains breakout potential
Looking ahead, MSTR is likely to trade within the $125.98 to $143.54 volatility band over the next several sessions. Statistical models assign a 68% probability of downward movement, with a 32% chance of an upside breakout. The base case scenario expects the stock to remain inside this established corridor. A move above immediate resistance could trigger a bullish momentum swing, whereas a drop below support may open the door for an extended bearish cycle.
Earlier, analysts noted that Strategy’s technical outlook remained challenged despite significant Bitcoin accumulation and reduced leverage. The latest developments reinforce this cautious stance, with statistical models now emphasizing a 68% probability of continued downside within the current $125.98 to $143.54 trading corridor, making a close watch on the lower support band prudent for risk management.






Latest Strategy News




-
 Afghanistan
-
 Albania
-
 Algeria
-
 Angola
-
 Argentina
-
 Armenia
-
 Australia
-
 Austria
-
 Azerbaijan
-
 Bahamas
-
 Bahrain
-
 Bangladesh
-
 Belarus
-
 Belgium
-
 Bolivia
-
 Botswana
-
 Brazil
-
 Brunei
-
 Bulgaria
-
 Cambodia
-
 Cameroon
-
 Canada
-
 Chile
-
 China
-
 Colombia
-
 Congo
-
 Costa Rica
-
 Cote d'Ivoire
-
 Croatia
-
 Cuba
-
 Cyprus
-
 Czechia
-
 DR Congo
-
 Denmark
-
 Dominican Republic
-
 Ecuador
-
 Egypt
-
 El Salvador
-
 Estonia
-
 Eswatini
-
 Ethiopia
-
 Finland
-
 France
-
 Georgia
-
 Germany
-
 Ghana
-
 Greece
-
 Haiti
-
 Hong Kong
-
 Hungary
-
 India
-
 Indonesia
-
 Iran, Islamic republic
-
 Iraq
-
 Ireland
-
 Israel
-
 Italy
-
 Jamaica
-
 Japan
-
 Jordan
-
 Kazakhstan
-
 Kenya
-
 Korea
-
 Kuwait
-
 Kyrgyzstan
-
 Laos
-
 Latvia
-
 Lebanon
-
 Lesotho
-
 Libya
-
 Lithuania
-
 Luxembourg
-
 Madagascar
-
 Malaysia
-
 Malta
-
 Mauritius
-
 Mexico
-
 Moldova
-
 Mongolia
-
 Montenegro
-
 Morocco
-
 Mozambique
-
 Myanmar
-
 Namibia
-
 Nepal
-
 Netherlands
-
 New Zealand
-
 Nigeria
-
 North Macedonia
-
 Norway
-
 Oman
-
 Pakistan
-
 Palestine
-
 Panama
-
 Papua New Guinea
-
 Paraguay
-
 Peru
-
 Philippines
-
 Poland
-
 Portugal
-
 Puerto Rico
-
 Qatar
-
 Reunion
-
 Romania
-
 Rwanda
-
 Saudi Arabia
-
 Serbia
-
 Singapore
-
 Slovakia
-
 Slovenia
-
 Somalia
-
 South Africa
-
 Spain
-
 Sri Lanka
-
 Sweden
-
 Switzerland
-
 Syria
-
 Taiwan
-
 Tajikistan
-
 Tanzania
-
 Thailand
-
 Trinidad and Tobago
-
 Tunisia
-
 Turkey
-
 UAE
-
 Uganda
-
 Ukraine
-
 United Kingdom
-
United States
-
 Uruguay
-
 Uzbekistan
-
 Venezuela
-
 Vietnam
-
 Yemen
-
 Zambia
-
 Zimbabwe
- Forex
- Crypto












