

Honeywell stock gains more than 3% after quarterly results and bullish technical momentum

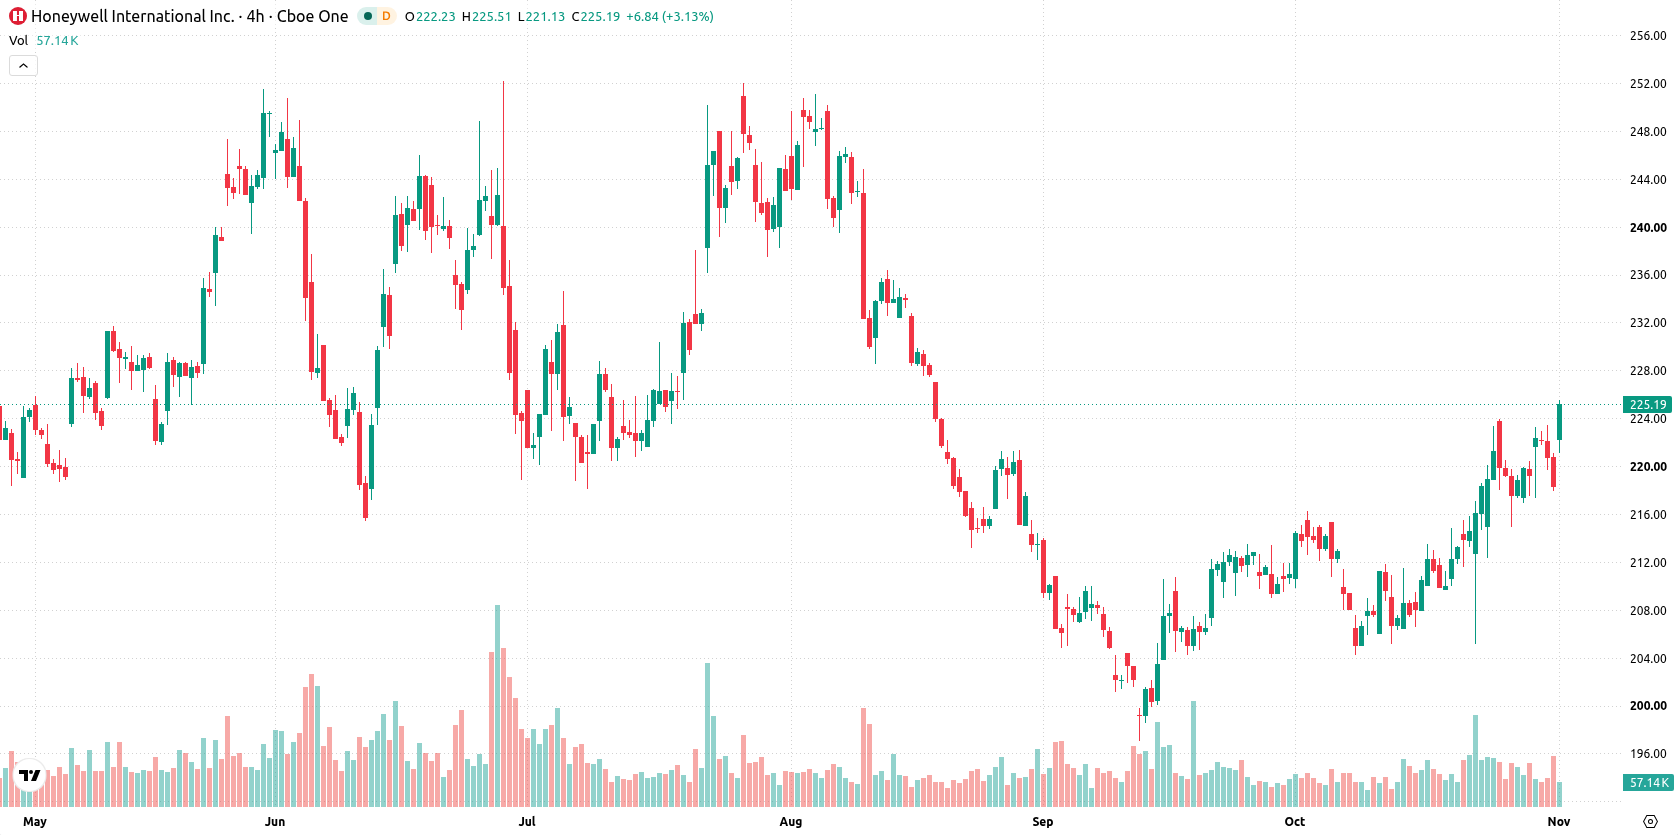
Honeywell International Inc. (HON) climbed 3.17% after quarterly results highlighted improved organic sales growth and a newly declared dividend, fueling buying demand. The move is supported by bullish short- and medium-term momentum as the price trades above all key moving averages.
 220.59
232.46
Highlights
- Honeywell Aerospace reported third-quarter 2026 organic sales growth of 2.4% to $4.6 billion and initiated a $0.40 per share dividend.
- Management increased standalone adjusted EPS guidance for 2026 to $7.85 to $8.00 and reiterated full-year organic revenue growth of 4% to 5%.
- Shares of Honeywell finished up 3.17%, trading above key moving averages with a five-day expected price range of $221.37 to $229.29 as indicator signals show mixed momentum and the intraday tone remains firm.
Upgraded forecasts and new dividend as expansion meets supply chain risks
Honeywell Aerospace Inc reported third-quarter 2026 results with organic sales growth of 2.4% to $4.6 billion and announced its first quarterly cash dividend of $0.40 per share. Management raised pro forma standalone adjusted EPS guidance for 2026 to $7.85–$8.00 and maintained forecasts for full-year organic revenue growth of 4% to 5%. The company is expanding production capacity in Tempe, Arizona while addressing lingering supply chain constraints with measures to increase multi-sourcing and supplier output.
Mixed momentum signals as bullish alignment challenges overbought risks
Honeywell is trading above all key moving averages, with the current price at $225.33 holding above the 20-day ($213.55), 50-day ($211.63), and 200-day ($224.52) levels. This multi-timeframe positioning suggests bullish momentum in the short and medium term, and the 200-day average acts as the immediate floor at $224.52 while resistance is seen at $229.29. The overall long-term trend remains cautious, as the 50-day and 200-day averages remain in a bearish alignment. Momentum indicators are mixed: the MACD and RSI both lean bullish, with RSI at 57.11 and MACD at 3.14 giving buy signals, but the Average Directional Index (ADX) shows a neutral reading of 19.94. The Commodity Channel Index (CCI) and Bull/Bear Power (BBP) are both above thresholds, signaling overbought conditions, and the BBP indicates continued buyer dominance intraday. However, the Stochastic RSI gives a strong sell signal, suggesting a short-term pullback may be likely, creating a divergence as most other signals favor buyers.
Previously it was reported that Honeywell Aerospace raised its cash flow outlook and approved a new dividend while pointing to progress in resolving supply chain constraints. The current technical setup strengthens this outlook, but with indicators diverging and overbought signals appearing, a close watch on the $229.29 resistance level is crucial for assessing the sustainability of recent gains.






Latest Honeywell News





-
 Afghanistan
-
 Albania
-
 Algeria
-
 Angola
-
 Argentina
-
 Armenia
-
 Australia
-
 Austria
-
 Azerbaijan
-
 Bahamas
-
 Bahrain
-
 Bangladesh
-
 Belarus
-
 Belgium
-
 Bolivia
-
 Botswana
-
 Brazil
-
 Brunei
-
 Bulgaria
-
 Cambodia
-
 Cameroon
-
 Canada
-
 Chile
-
 China
-
 Colombia
-
 Congo
-
 Costa Rica
-
 Cote d'Ivoire
-
 Croatia
-
 Cuba
-
 Cyprus
-
 Czechia
-
 DR Congo
-
 Denmark
-
 Dominican Republic
-
 Ecuador
-
 Egypt
-
 El Salvador
-
 Estonia
-
 Eswatini
-
 Ethiopia
-
 Finland
-
 France
-
 Georgia
-
 Germany
-
 Ghana
-
 Greece
-
 Haiti
-
 Hong Kong
-
 Hungary
-
 India
-
 Indonesia
-
 Iran, Islamic republic
-
 Iraq
-
 Ireland
-
 Israel
-
 Italy
-
 Jamaica
-
 Japan
-
 Jordan
-
 Kazakhstan
-
 Kenya
-
 Korea
-
 Kuwait
-
 Kyrgyzstan
-
 Laos
-
 Latvia
-
 Lebanon
-
 Lesotho
-
 Libya
-
 Lithuania
-
 Luxembourg
-
 Madagascar
-
 Malaysia
-
 Malta
-
 Mauritius
-
 Mexico
-
 Moldova
-
 Mongolia
-
 Montenegro
-
 Morocco
-
 Mozambique
-
 Myanmar
-
 Namibia
-
 Nepal
-
 Netherlands
-
 New Zealand
-
 Nigeria
-
 North Macedonia
-
 Norway
-
 Oman
-
 Pakistan
-
 Palestine
-
 Panama
-
 Papua New Guinea
-
 Paraguay
-
 Peru
-
 Philippines
-
 Poland
-
 Portugal
-
 Puerto Rico
-
 Qatar
-
 Reunion
-
 Romania
-
 Rwanda
-
 Saudi Arabia
-
 Serbia
-
 Singapore
-
 Slovakia
-
 Slovenia
-
 Somalia
-
 South Africa
-
 Spain
-
 Sri Lanka
-
 Sweden
-
 Switzerland
-
 Syria
-
 Taiwan
-
 Tajikistan
-
 Tanzania
-
 Thailand
-
 Trinidad and Tobago
-
 Tunisia
-
 Turkey
-
 UAE
-
 Uganda
-
 Ukraine
-
 United Kingdom
-
United States
-
 Uruguay
-
 Uzbekistan
-
 Venezuela
-
 Vietnam
-
 Yemen
-
 Zambia
-
 Zimbabwe
- Forex
- Crypto












