

Fidelity National Information Services shares technical analysis: Upward price move as buyer support dominates

Fidelity National Information Services (FIS) stock is trading at $39.89 after gaining 3.49% for the day. The price sits above its key moving averages, indicating short- and medium-term strength against the broader trend.
 29.58
30.50
Highlights
- Fidelity National Information Services will report third-quarter 2026 earnings on November 3, with focus on Banking Solutions and Capital Markets performance.
- Investor trading positions are concentrated ahead of the release, as market participants seek clarity on financial health and capital allocation.
- Shares of Fidelity National Information Services gained 3.49% to close at $39.89, with strong short- and medium-term momentum and an expected price range of $38.05 to $41.73 over the next 2 to 3 days.
Earnings expectations drive investor flows and lift shares
Fidelity National Information Services is set to report its third-quarter 2026 earnings on November 3, 2026, according to Investing.com. Market participants are closely tracking anticipated results in its Banking Solutions and Capital Markets segments, with expectations of clarity around financial health fueling current trading activity. The upcoming earnings release acts as a focal point for investor positioning, creating upward pressure on shares as participants respond to potential changes in growth and capital allocation.
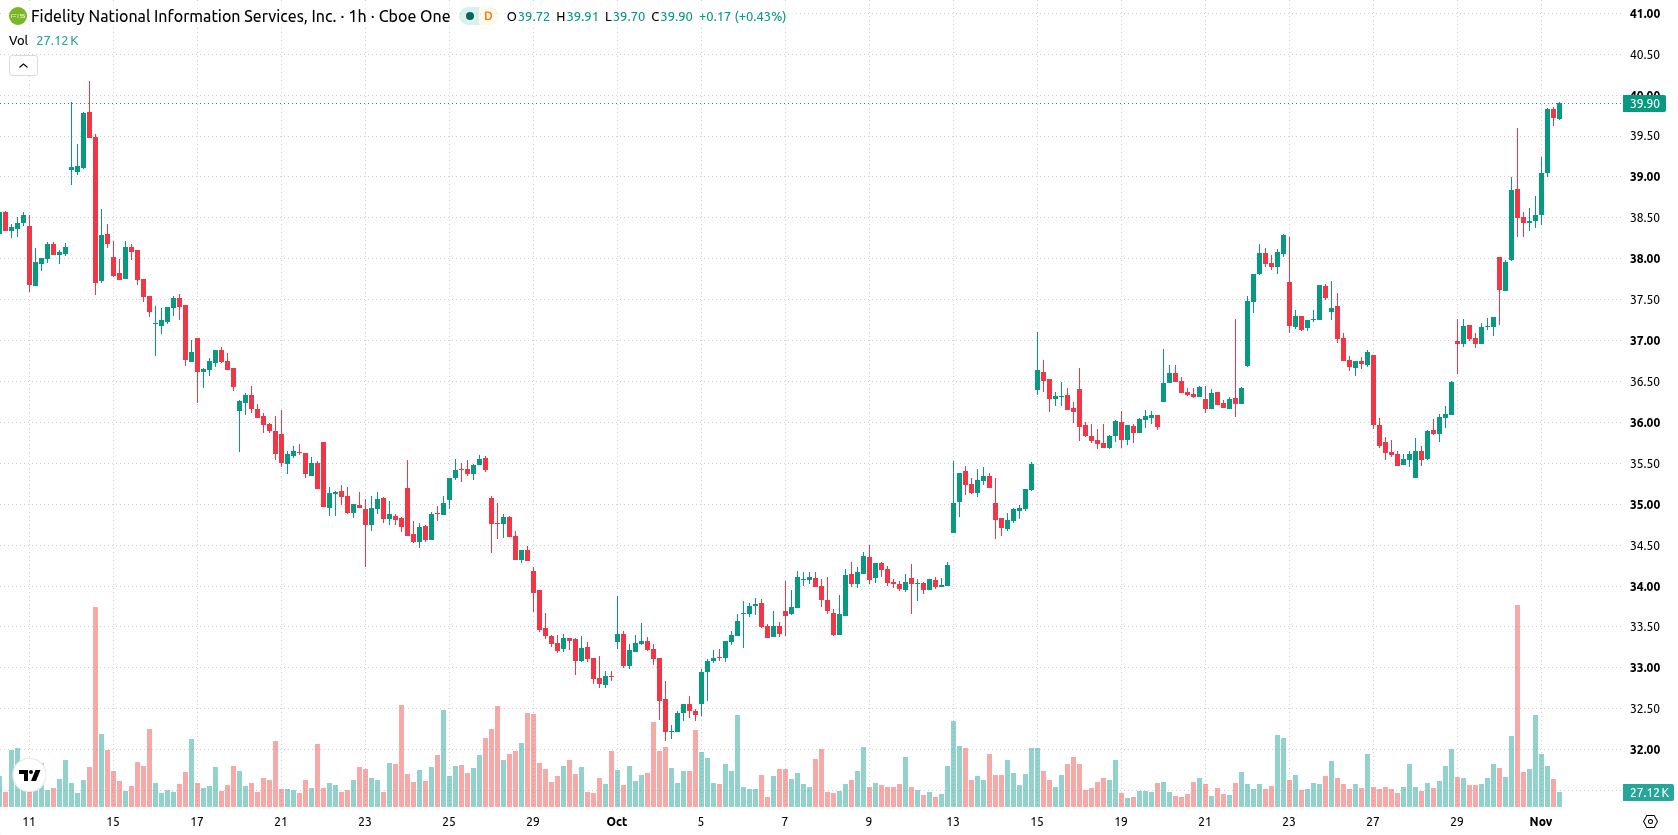
Strong momentum as price clears mid-term barriers but lags MA-200
The price has moved above its MA-20 and MA-50 on the h1 timeframe, while remaining below the long-term MA-200. The Ichimoku Kijun at $37.46 is providing immediate support. Momentum indicators confirm strong buying, as both MACD and ADX issue buy signals. RSI stands at 75.56 and, together with CCI, signals overbought conditions, echoing the Stochastic RSI buy signal. Bull/Bear Power also underscores buyer dominance, while the Awesome Oscillator affirms upward momentum.
Bullish outlook capped by volatility range and key support
In the short term, FIS is expected to trade within a $38.05–$41.73 volatility band relative to current levels over the next 2–3 sessions. The base case envisions consolidation within this range, supported by bullish indicator signals. If the price breaks above the top of this corridor, further gains are possible, while a move below immediate support at the Ichimoku Kijun could prompt declines toward lower levels.
Previously it was reported that Fidelity National Information Services demonstrated a technical shift toward short- and medium-term strength, with buyers gaining control as upward momentum developed. The current analysis strengthens this view by highlighting persistent bullish signals and overbought conditions, suggesting the prevailing scenario remains constructive as long as the price holds above the Ichimoku Kijun at $37.46.










-
 Afghanistan
-
 Albania
-
 Algeria
-
 Angola
-
 Argentina
-
 Armenia
-
 Australia
-
 Austria
-
 Azerbaijan
-
 Bahamas
-
 Bahrain
-
 Bangladesh
-
 Belarus
-
 Belgium
-
 Bolivia
-
 Botswana
-
 Brazil
-
 Brunei
-
 Bulgaria
-
 Cambodia
-
 Cameroon
-
 Canada
-
 Chile
-
 China
-
 Colombia
-
 Congo
-
 Costa Rica
-
 Cote d'Ivoire
-
 Croatia
-
 Cuba
-
 Cyprus
-
 Czechia
-
 DR Congo
-
 Denmark
-
 Dominican Republic
-
 Ecuador
-
 Egypt
-
 El Salvador
-
 Estonia
-
 Eswatini
-
 Ethiopia
-
 Finland
-
 France
-
 Georgia
-
 Germany
-
 Ghana
-
 Greece
-
 Haiti
-
 Hong Kong
-
 Hungary
-
 India
-
 Indonesia
-
 Iran, Islamic republic
-
 Iraq
-
 Ireland
-
 Israel
-
 Italy
-
 Jamaica
-
 Japan
-
 Jordan
-
 Kazakhstan
-
 Kenya
-
 Korea
-
 Kuwait
-
 Kyrgyzstan
-
 Laos
-
 Latvia
-
 Lebanon
-
 Lesotho
-
 Libya
-
 Lithuania
-
 Luxembourg
-
 Madagascar
-
 Malaysia
-
 Malta
-
 Mauritius
-
 Mexico
-
 Moldova
-
 Mongolia
-
 Montenegro
-
 Morocco
-
 Mozambique
-
 Myanmar
-
 Namibia
-
 Nepal
-
 Netherlands
-
 New Zealand
-
 Nigeria
-
 North Macedonia
-
 Norway
-
 Oman
-
 Pakistan
-
 Palestine
-
 Panama
-
 Papua New Guinea
-
 Paraguay
-
 Peru
-
 Philippines
-
 Poland
-
 Portugal
-
 Puerto Rico
-
 Qatar
-
 Reunion
-
 Romania
-
 Rwanda
-
 Saudi Arabia
-
 Serbia
-
 Singapore
-
 Slovakia
-
 Slovenia
-
 Somalia
-
 South Africa
-
 Spain
-
 Sri Lanka
-
 Sweden
-
 Switzerland
-
 Syria
-
 Taiwan
-
 Tajikistan
-
 Tanzania
-
 Thailand
-
 Trinidad and Tobago
-
 Tunisia
-
 Turkey
-
 UAE
-
 Uganda
-
 Ukraine
-
 United Kingdom
-
United States
-
 Uruguay
-
 Uzbekistan
-
 Venezuela
-
 Vietnam
-
 Yemen
-
 Zambia
-
 Zimbabwe
- Forex
- Crypto












