

META shares weekly forecast: Downside momentum holds as MACD and Awesome Oscillator stay negative

Shares of Meta Platforms (META, formerly Facebook, Inc.) are trading near $607 after a decline of nearly 1.4% this week. The drop reflects ongoing corporate pressures as the stock enters oversold territory, with traders focused on whether a rebound risk emerges in the days ahead.
 624.84
634.66
Highlights
- Shares of Meta Platforms fell 1.38% over the past 7 days to $606.74, trading below key moving averages.
- Downside momentum remains strong, but oversold indicator signals raise the risk of near-term selling exhaustion and possible rebound.
- Price action is contained between support at $606.41 and resistance at $632.01, with a projected weekly range of $594.1 to $619.37.
Capital expenses outweigh revenue gains as funding moves reshape outlook
Meta's Q3 2026 earnings release on October 21, 2026 revealed strong revenue growth and robust investment in artificial intelligence, but also highlighted rising expenses and high capital expenditures, according to CSIA Market Analytics. S&P Global Ratings revised its outlook on META to negative over concerns about high capex and weaker free cash flow, CNBC reported. In response to its funding needs, META is preparing a potential investment-grade bond offering targeting at least $20 billion and has launched approximately $35 billion of public offerings alongside a planned $60 billion at-the-market equity program, as reported by Bloomberg and Digitimes.
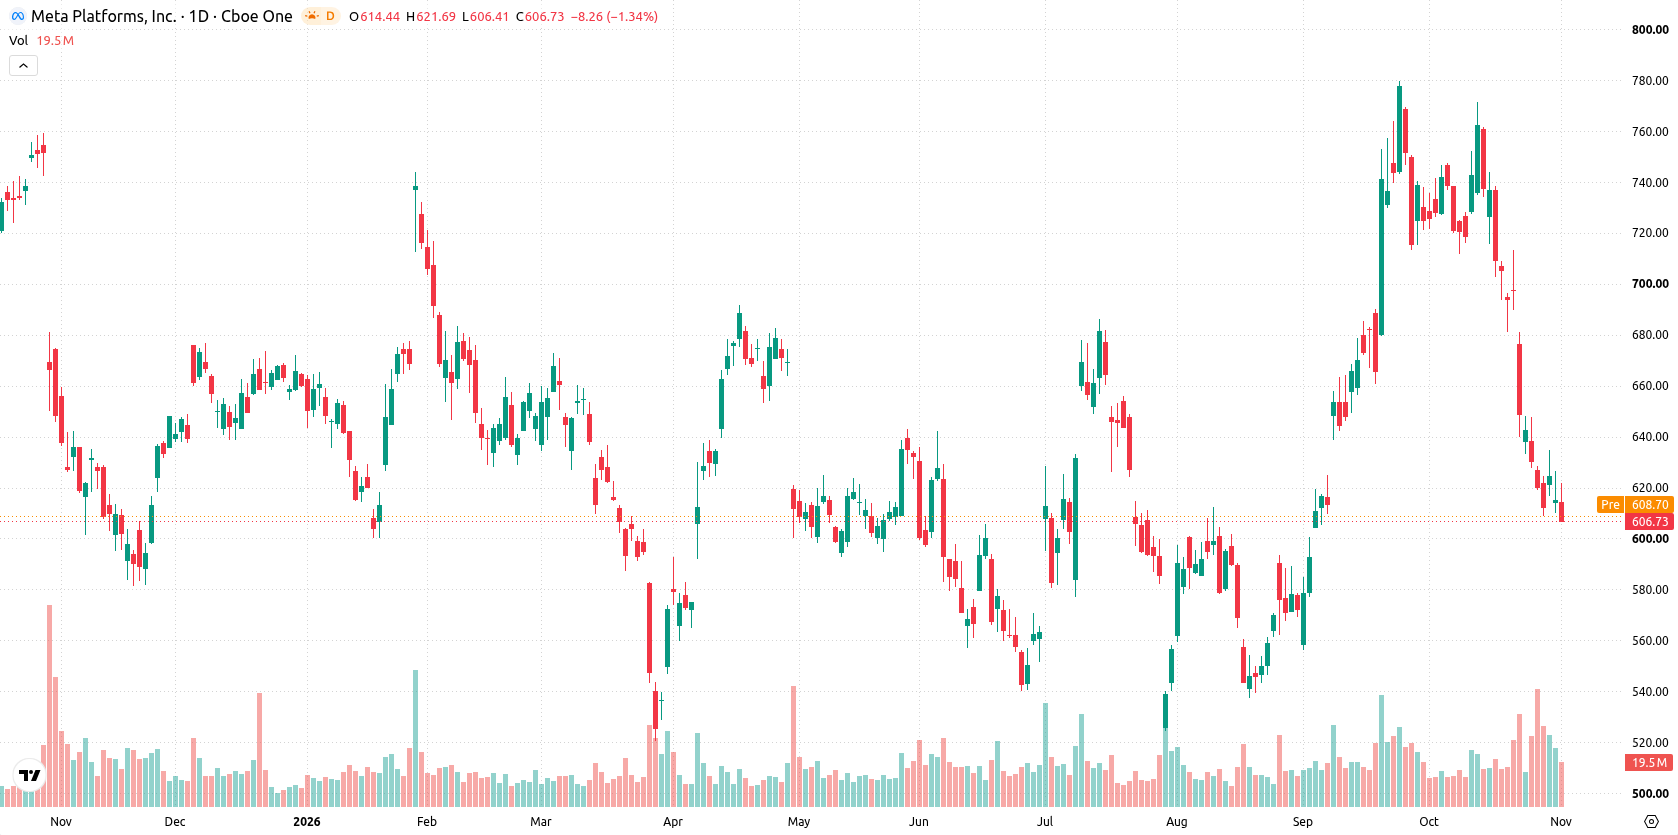
Downside momentum persists as oversold signals warn of exhaustion risk
On the daily chart, Meta shares are tracking a sustained move lower with a firm trend, underpinned by a 4.66% weekly volatility. The CCI and Stochastic RSI are both in oversold territory, with CCI at -104.68 and Stochastic RSI at 5.58, highlighting a possible risk of selling exhaustion and short-term rebound potential. However, the MACD and Awesome Oscillator are both negative, confirming clear downside momentum. Price action is pinned to support at $606.41, with resistance visible at $632.01 from the 200-day moving average and the Ichimoku Kijun acting as further overhead resistance.
Deeper declines favored unless support holds in coming week
In the week ahead, the expected range is $594.1 to $619.37, with a 21% probability of an increase and a 79% probability of a decrease. The base case sees price stabilising between immediate support at $606.41 and resistance at $632.01. A break above $632.01 would signal scope for a short-term rebound, while a drop below $606.41 would increase the risk of a deeper decline towards $594.1.
Previously it was reported that analysts saw ongoing downside pressure for Meta Platforms due to persistent technical weakness and concerns about rising AI-related expenses. Building on this, the current analysis highlights the importance of the $606.41 support level, with sustained downside momentum suggesting that a break below this threshold could expose Meta shares to an extended move lower toward $594.1 in the coming week.











-
 Afghanistan
-
 Albania
-
 Algeria
-
 Angola
-
 Argentina
-
 Armenia
-
 Australia
-
 Austria
-
 Azerbaijan
-
 Bahamas
-
 Bahrain
-
 Bangladesh
-
 Belarus
-
 Belgium
-
 Bolivia
-
 Botswana
-
 Brazil
-
 Brunei
-
 Bulgaria
-
 Cambodia
-
 Cameroon
-
 Canada
-
 Chile
-
 China
-
 Colombia
-
 Congo
-
 Costa Rica
-
 Cote d'Ivoire
-
 Croatia
-
 Cuba
-
 Cyprus
-
 Czechia
-
 DR Congo
-
 Denmark
-
 Dominican Republic
-
 Ecuador
-
 Egypt
-
 El Salvador
-
 Estonia
-
 Eswatini
-
 Ethiopia
-
 Finland
-
 France
-
 Georgia
-
 Germany
-
 Ghana
-
 Greece
-
 Haiti
-
 Hong Kong
-
 Hungary
-
 India
-
 Indonesia
-
 Iran, Islamic republic
-
 Iraq
-
 Ireland
-
 Israel
-
 Italy
-
 Jamaica
-
 Japan
-
 Jordan
-
 Kazakhstan
-
 Kenya
-
 Korea
-
 Kuwait
-
 Kyrgyzstan
-
 Laos
-
 Latvia
-
 Lebanon
-
 Lesotho
-
 Libya
-
 Lithuania
-
 Luxembourg
-
 Madagascar
-
 Malaysia
-
 Malta
-
 Mauritius
-
 Mexico
-
 Moldova
-
 Mongolia
-
 Montenegro
-
 Morocco
-
 Mozambique
-
 Myanmar
-
 Namibia
-
 Nepal
-
 Netherlands
-
 New Zealand
-
 Nigeria
-
 North Macedonia
-
 Norway
-
 Oman
-
 Pakistan
-
 Palestine
-
 Panama
-
 Papua New Guinea
-
 Paraguay
-
 Peru
-
 Philippines
-
 Poland
-
 Portugal
-
 Puerto Rico
-
 Qatar
-
 Reunion
-
 Romania
-
 Rwanda
-
 Saudi Arabia
-
 Serbia
-
 Singapore
-
 Slovakia
-
 Slovenia
-
 Somalia
-
 South Africa
-
 Spain
-
 Sri Lanka
-
 Sweden
-
 Switzerland
-
 Syria
-
 Taiwan
-
 Tajikistan
-
 Tanzania
-
 Thailand
-
 Trinidad and Tobago
-
 Tunisia
-
 Turkey
-
 UAE
-
 Uganda
-
 Ukraine
-
 United Kingdom
-
United States
-
 Uruguay
-
 Uzbekistan
-
 Venezuela
-
 Vietnam
-
 Yemen
-
 Zambia
-
 Zimbabwe
- Forex
- Crypto












