

Visa shares weekly forecast: Advance stalls below resistance at $426.7 as technical signals flash overbought

Shares of Visa Inc. (V) are trading near $425 after advancing around 3% last week as a rally continues but faces signs of overheating. While the strong run reflects upbeat earnings and expanded shareholder returns, overbought signals now set the tone for a potentially volatile week ahead.
 424.15
437.61
Highlights
- Shares of Visa climbed 2.86% in the past week to $425.47, maintaining a strong upward trend above key averages.
- Technical indicators show the stock is overbought on the daily chart, with strong momentum and elevated volatility.
- Over the next week, Visa stock is expected to trade between $412.44 and $451.13, with immediate support at $398.94 and resistance at $426.7.
Earnings strength and dividend hike drive upbeat sentiment during the week
Visa posted strong fourth-quarter results with revenue of $12.14 billion and net income of $6.0 billion, supported by robust cross-border volume and international travel, according to Yahoo Finance. The company raised its quarterly dividend by 16% to $0.78 per share and returned a record $25.6 billion to shareholders this fiscal year through dividends and buybacks, as noted by TradingView. In addition, Visa's stablecoin settlement business surpassed a $25 billion annualized run rate as the network expanded to 10 blockchains and five stablecoins.
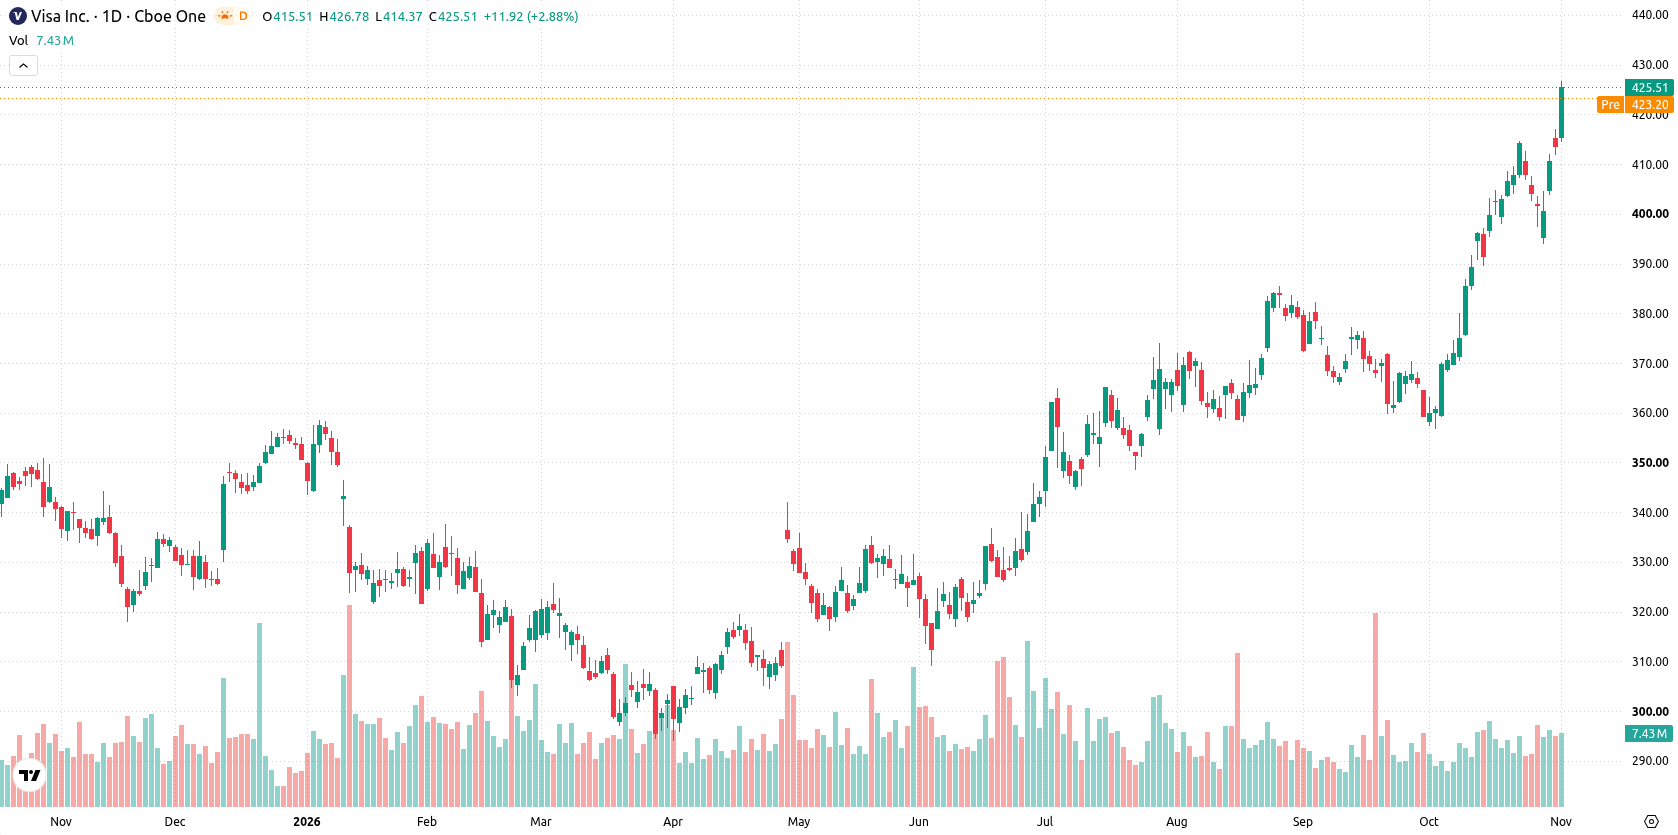
Overbought technicals emerge as momentum holds above key support
The daily chart shows a sustained move higher with a firm trend, as reflected by a trending setup and 7.32% volatility this week. Both the RSI at 74.95 and CCI at 154.37 are in overbought territory, raising the risk of a near-term correction. MACD and ADX both support continued upside momentum. Immediate support sits at the 20-day moving average of $398.94, while the stock is pinned to resistance at the weekly high of $426.7. On the weekly chart the longer-term picture stays firmly constructive.
Further gains likely barring breakdown below medium-term support
Over the coming trading week, Visa stock is expected to trade within a range of $412.44 to $451.13. There is a very high probability (more than 80%) of further gains and a very low probability (less than 20%) of a decline. As a base scenario, sustained trading between support at $398.94 and resistance at $426.7 is likely. A breakout above $426.7 could open the way toward the upper end of the expected range. Failure to hold $398.94 would signal risk for a deeper pullback below support.
Earlier, analysts noted that Visa is leveraging blockchain and stablecoin payment initiatives as a growing revenue stream, integrating these technologies more deeply into its core business. With signs of near-term overheating despite strong fundamentals, traders should watch for a decisive move above $426.7 to signal renewed upside, while failure to hold $398.94 may trigger a deeper pullback.











-
 Afghanistan
-
 Albania
-
 Algeria
-
 Angola
-
 Argentina
-
 Armenia
-
 Australia
-
 Austria
-
 Azerbaijan
-
 Bahamas
-
 Bahrain
-
 Bangladesh
-
 Belarus
-
 Belgium
-
 Bolivia
-
 Botswana
-
 Brazil
-
 Brunei
-
 Bulgaria
-
 Cambodia
-
 Cameroon
-
 Canada
-
 Chile
-
 China
-
 Colombia
-
 Congo
-
 Costa Rica
-
 Cote d'Ivoire
-
 Croatia
-
 Cuba
-
 Cyprus
-
 Czechia
-
 DR Congo
-
 Denmark
-
 Dominican Republic
-
 Ecuador
-
 Egypt
-
 El Salvador
-
 Estonia
-
 Eswatini
-
 Ethiopia
-
 Finland
-
 France
-
 Georgia
-
 Germany
-
 Ghana
-
 Greece
-
 Haiti
-
 Hong Kong
-
 Hungary
-
 India
-
 Indonesia
-
 Iran, Islamic republic
-
 Iraq
-
 Ireland
-
 Israel
-
 Italy
-
 Jamaica
-
 Japan
-
 Jordan
-
 Kazakhstan
-
 Kenya
-
 Korea
-
 Kuwait
-
 Kyrgyzstan
-
 Laos
-
 Latvia
-
 Lebanon
-
 Lesotho
-
 Libya
-
 Lithuania
-
 Luxembourg
-
 Madagascar
-
 Malaysia
-
 Malta
-
 Mauritius
-
 Mexico
-
 Moldova
-
 Mongolia
-
 Montenegro
-
 Morocco
-
 Mozambique
-
 Myanmar
-
 Namibia
-
 Nepal
-
 Netherlands
-
 New Zealand
-
 Nigeria
-
 North Macedonia
-
 Norway
-
 Oman
-
 Pakistan
-
 Palestine
-
 Panama
-
 Papua New Guinea
-
 Paraguay
-
 Peru
-
 Philippines
-
 Poland
-
 Portugal
-
 Puerto Rico
-
 Qatar
-
 Reunion
-
 Romania
-
 Rwanda
-
 Saudi Arabia
-
 Serbia
-
 Singapore
-
 Slovakia
-
 Slovenia
-
 Somalia
-
 South Africa
-
 Spain
-
 Sri Lanka
-
 Sweden
-
 Switzerland
-
 Syria
-
 Taiwan
-
 Tajikistan
-
 Tanzania
-
 Thailand
-
 Trinidad and Tobago
-
 Tunisia
-
 Turkey
-
 UAE
-
 Uganda
-
 Ukraine
-
 United Kingdom
-
United States
-
 Uruguay
-
 Uzbekistan
-
 Venezuela
-
 Vietnam
-
 Yemen
-
 Zambia
-
 Zimbabwe
- Forex
- Crypto












