

AbbVie stock weekly forecast: MACD and ADX support further upside as momentum trends higher

Shares of AbbVie Inc. (ABBV) are trading near $289 after dipping around 2% this week, with buyers remaining in control despite the pullback. The stock continues to hold its recent gains, and upbeat corporate results could keep sentiment steady as the new week begins.
 291.04
298.50
Highlights
- Shares of AbbVie fell 2.01% over the past week to $288.94, but maintain a bullish long-term structure.
- Weekly volatility is measured at 5.99%, and momentum indicators suggest potential for further upside despite recent weakness.
- The stock is expected to trade in a range of $281.39 to $302.5, with 77% probability of an increase and nearest resistance at $298.5.
Improved guidance and drug updates lift outlook after strong quarterly results
AbbVie reported third-quarter 2026 financial results with revenue of $17.4 billion, an operational increase of 10.5%, and adjusted diluted EPS of $3.82, both more than double year over year, according to PR Newswire. The company raised its full-year 2026 revenue guidance to $67.8 billion and increased its quarterly dividend by 5.2% to $1.82 per share, effective with the February 2027 payment, as reported by Yahoo Finance. AbbVie also highlighted strong performance from its immunology drugs Skyrizi and Rinvoq, as well as positive updates on its combination therapy for Crohn’s disease and the acquisition of Apogee to boost its late-stage pipeline.
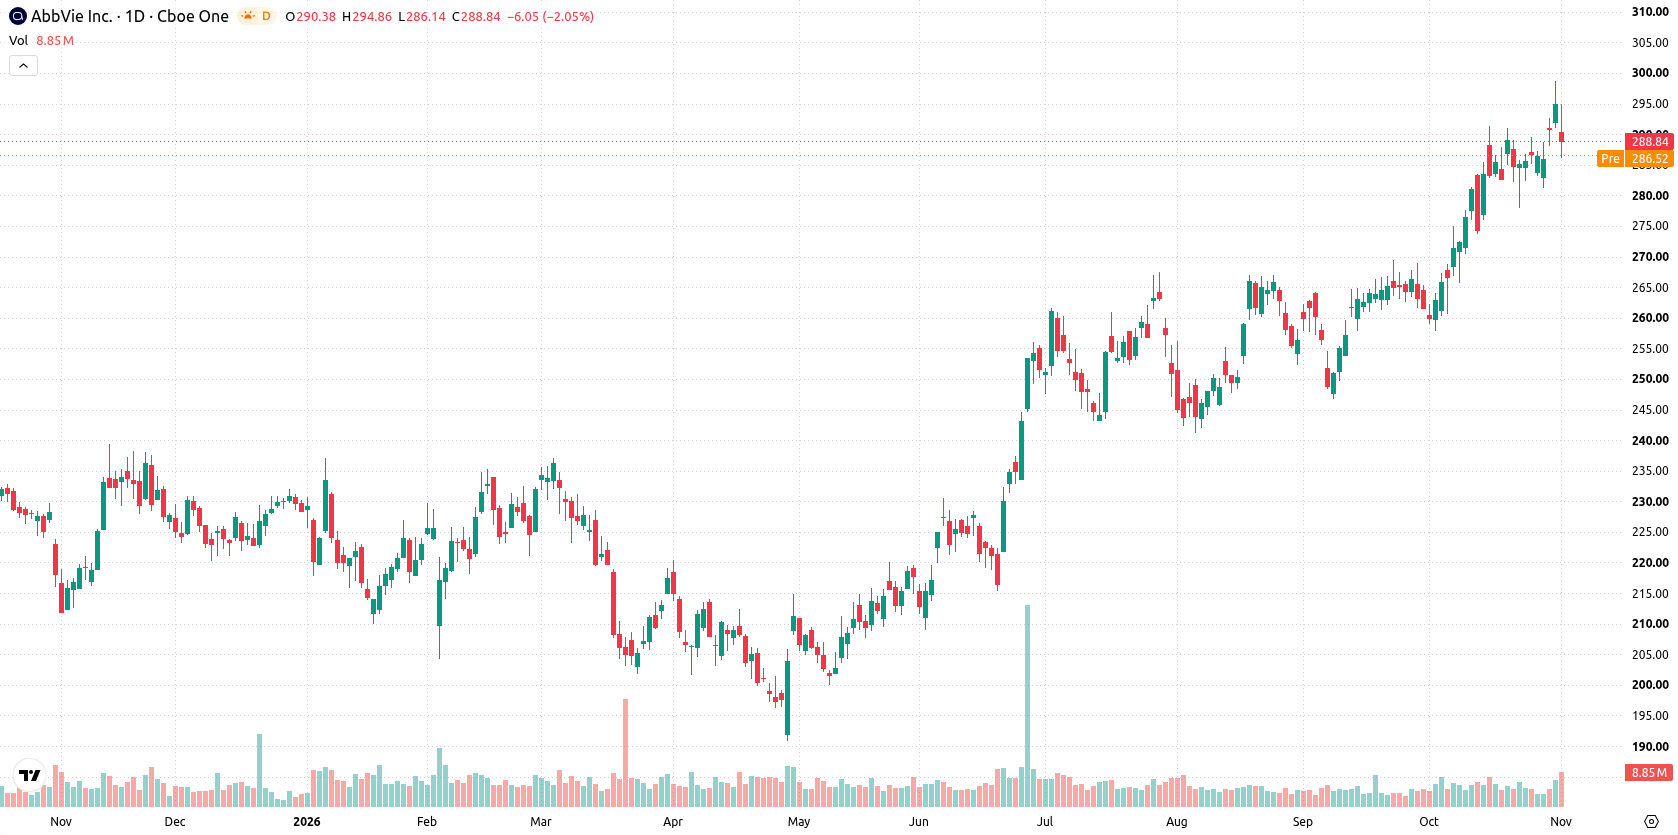
Upside bias holds as MACD and ADX strengthen despite short-term divergence
The daily chart shows a trending setup, with momentum characterized by a sustained move lower and a firm trend amid 5.99% weekly volatility. MACD and ADX both favor further upside, while level-based oscillators such as RSI (63.45) and CCI are in neutral zones, though Stochastic RSI is in its oversold zone, pointing to potential divergence in short-term momentum. Nearest support sits at $282.84 (20-day MA), while resistance stands at $298.5, with the Ichimoku Kijun at $278.4 acting as additional support.
Consolidation likely with breakout risk around resistance in the coming week
In the week ahead, AbbVie is expected to trade within a range of $281.39 to $302.5. There is a 77% probability of an increase and a 23% chance of a decrease. The base case calls for consolidation or further trend development between $282.84 support and $298.5 resistance. A break above $298.5 would open the way for further gains toward the upper end of the expected range, while a move below $282.84 could trigger additional downside toward $281.39 or the Ichimoku support at $278.4.
Earlier, analysts noted that AbbVie's underlying technical trend remained constructive despite mixed momentum readings and persistent equity market volatility. The current setup introduces a potential inflection point, with traders advised to monitor the $298.5 resistance level for confirmation of renewed upside momentum.






Latest AbbVie News




-
 Afghanistan
-
 Albania
-
 Algeria
-
 Angola
-
 Argentina
-
 Armenia
-
 Australia
-
 Austria
-
 Azerbaijan
-
 Bahamas
-
 Bahrain
-
 Bangladesh
-
 Belarus
-
 Belgium
-
 Bolivia
-
 Botswana
-
 Brazil
-
 Brunei
-
 Bulgaria
-
 Cambodia
-
 Cameroon
-
 Canada
-
 Chile
-
 China
-
 Colombia
-
 Congo
-
 Costa Rica
-
 Cote d'Ivoire
-
 Croatia
-
 Cuba
-
 Cyprus
-
 Czechia
-
 DR Congo
-
 Denmark
-
 Dominican Republic
-
 Ecuador
-
 Egypt
-
 El Salvador
-
 Estonia
-
 Eswatini
-
 Ethiopia
-
 Finland
-
 France
-
 Georgia
-
 Germany
-
 Ghana
-
 Greece
-
 Haiti
-
 Hong Kong
-
 Hungary
-
 India
-
 Indonesia
-
 Iran, Islamic republic
-
 Iraq
-
 Ireland
-
 Israel
-
 Italy
-
 Jamaica
-
 Japan
-
 Jordan
-
 Kazakhstan
-
 Kenya
-
 Korea
-
 Kuwait
-
 Kyrgyzstan
-
 Laos
-
 Latvia
-
 Lebanon
-
 Lesotho
-
 Libya
-
 Lithuania
-
 Luxembourg
-
 Madagascar
-
 Malaysia
-
 Malta
-
 Mauritius
-
 Mexico
-
 Moldova
-
 Mongolia
-
 Montenegro
-
 Morocco
-
 Mozambique
-
 Myanmar
-
 Namibia
-
 Nepal
-
 Netherlands
-
 New Zealand
-
 Nigeria
-
 North Macedonia
-
 Norway
-
 Oman
-
 Pakistan
-
 Palestine
-
 Panama
-
 Papua New Guinea
-
 Paraguay
-
 Peru
-
 Philippines
-
 Poland
-
 Portugal
-
 Puerto Rico
-
 Qatar
-
 Reunion
-
 Romania
-
 Rwanda
-
 Saudi Arabia
-
 Serbia
-
 Singapore
-
 Slovakia
-
 Slovenia
-
 Somalia
-
 South Africa
-
 Spain
-
 Sri Lanka
-
 Sweden
-
 Switzerland
-
 Syria
-
 Taiwan
-
 Tajikistan
-
 Tanzania
-
 Thailand
-
 Trinidad and Tobago
-
 Tunisia
-
 Turkey
-
 UAE
-
 Uganda
-
 Ukraine
-
 United Kingdom
-
United States
-
 Uruguay
-
 Uzbekistan
-
 Venezuela
-
 Vietnam
-
 Yemen
-
 Zambia
-
 Zimbabwe
- Forex
- Crypto












