

AMD stock outlook: Downtrend persists with eyes on $419.61 support

AMD (AMD) stock is trading at $470, down 6.98% on the day. The price sits below its key short- and medium-term moving averages, indicating ongoing downside momentum.
 455.01
508.16
Highlights
- Advanced Micro Devices will release third-quarter 2026 financial results after the US market closes on November 3, 2026, introducing near-term event risk.
- Expectations of critical earnings disclosures are increasing volatility and leading investors to reassess risk exposure ahead of the report.
- Shares of AMD fell 6.98% to $470 with strong selling pressure, bearish momentum, and high intraday volatility, with a projected range of $419.61 to $520.39 in coming sessions.
Volatility rises as investors brace for near-term earnings event risk
Advanced Micro Devices will report its third-quarter 2026 financial results after the US market close on November 3, 2026, accompanied by an earnings conference call at 5:00 p.m. ET the same day, according to TradingKey. The upcoming report introduces a defined near-term event risk, often prompting investors to adopt a more cautious stance as they await critical financial disclosures. This anticipation of key financial results can result in increased volatility and subdued demand as market participants reassess risk exposure in advance of the earnings release.
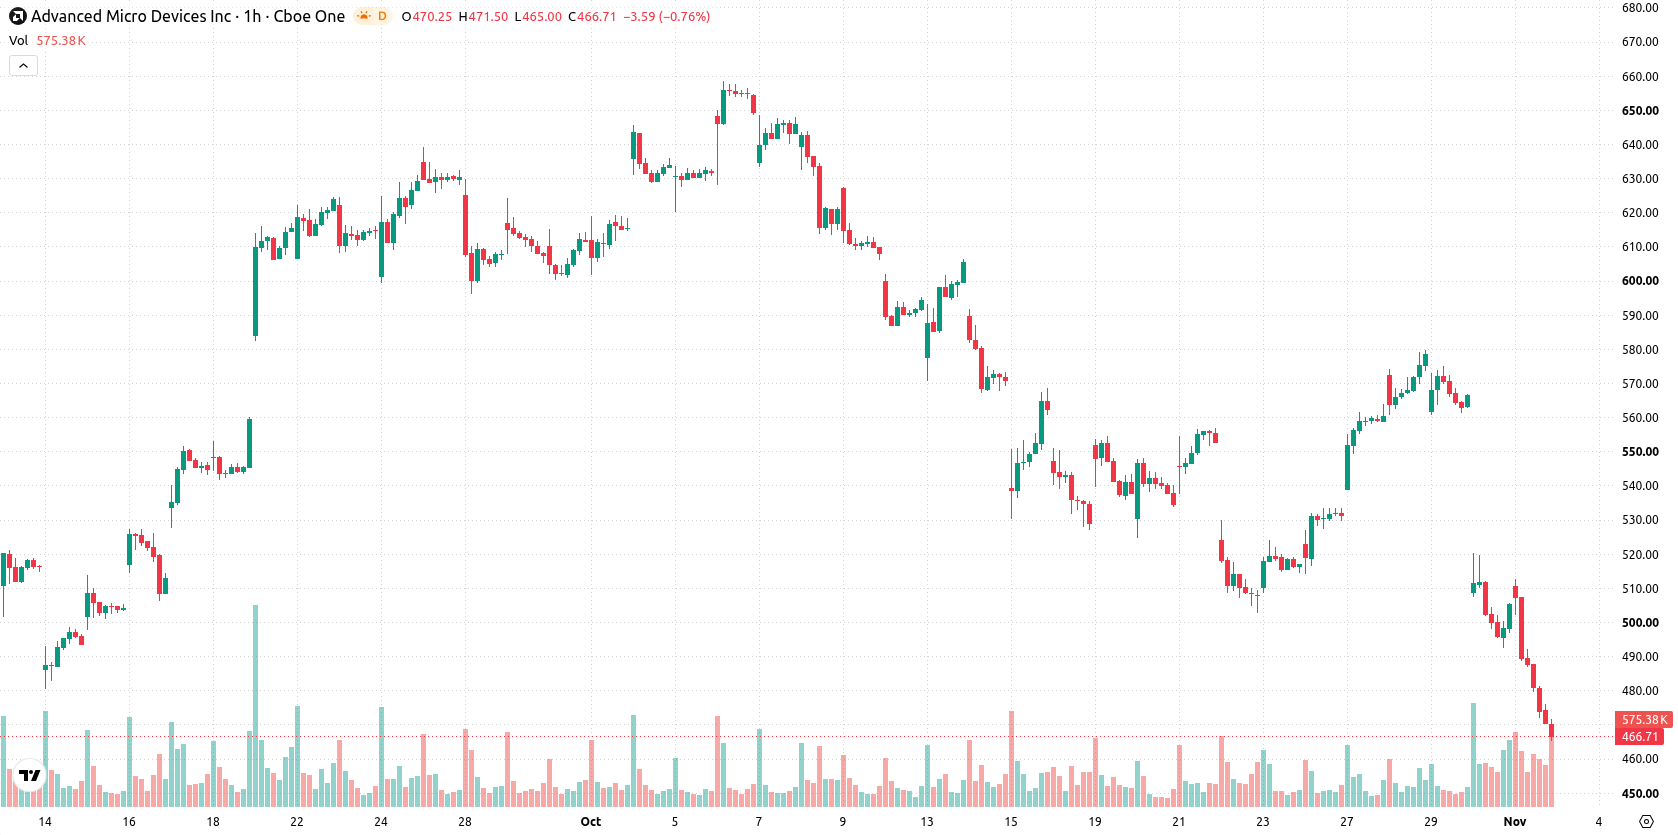
Technical selling pressure intensifies as intraday indicators hit oversold
On the hourly chart, AMD trades below both the MA-20 and MA-50, highlighting continued short- and medium-term technical pressure, while remaining above the MA-200, which serves as long-term support. The Ichimoku Kijun at $522.59 acts as immediate resistance, defining the upper boundary for potential rebounds. Momentum is negative, with MACD and ADX signaling Sell, and both Bull/Bear Power and the Awesome Oscillator confirming intraday seller dominance. Meanwhile, RSI, Stoch RSI, and CCI all signal confirmed oversold conditions, indicating that selling may be reaching exhaustion despite prevailing downside momentum.
Range-bound outlook as weak upside odds meet strong support levels
Over the next several sessions, AMD is expected to trade within a volatility band between $419.61 and $520.39. The probability model assigns a 25% chance to an upside move and a 75% chance to further downside. The base case is for range-bound price action within these levels. Upside requires a decisive break above immediate resistance at $522.59, while a close below the lower support would open the door to additional declines.
Earlier, analysts noted that Samsung's expansion in Texas is set to bolster AMD's semiconductor supply chain by securing advanced memory chip production capacity. The current technical setup for AMD suggests that traders should closely monitor $419.61 as a critical downside risk level, as sustained trading below this threshold could trigger further weakness beyond the established volatility band.











-
 Afghanistan
-
 Albania
-
 Algeria
-
 Angola
-
 Argentina
-
 Armenia
-
 Australia
-
 Austria
-
 Azerbaijan
-
 Bahamas
-
 Bahrain
-
 Bangladesh
-
 Belarus
-
 Belgium
-
 Bolivia
-
 Botswana
-
 Brazil
-
 Brunei
-
 Bulgaria
-
 Cambodia
-
 Cameroon
-
 Canada
-
 Chile
-
 China
-
 Colombia
-
 Congo
-
 Costa Rica
-
 Cote d'Ivoire
-
 Croatia
-
 Cuba
-
 Cyprus
-
 Czechia
-
 DR Congo
-
 Denmark
-
 Dominican Republic
-
 Ecuador
-
 Egypt
-
 El Salvador
-
 Estonia
-
 Eswatini
-
 Ethiopia
-
 Finland
-
 France
-
 Georgia
-
 Germany
-
 Ghana
-
 Greece
-
 Haiti
-
 Hong Kong
-
 Hungary
-
 India
-
 Indonesia
-
 Iran, Islamic republic
-
 Iraq
-
 Ireland
-
 Israel
-
 Italy
-
 Jamaica
-
 Japan
-
 Jordan
-
 Kazakhstan
-
 Kenya
-
 Korea
-
 Kuwait
-
 Kyrgyzstan
-
 Laos
-
 Latvia
-
 Lebanon
-
 Lesotho
-
 Libya
-
 Lithuania
-
 Luxembourg
-
 Madagascar
-
 Malaysia
-
 Malta
-
 Mauritius
-
 Mexico
-
 Moldova
-
 Mongolia
-
 Montenegro
-
 Morocco
-
 Mozambique
-
 Myanmar
-
 Namibia
-
 Nepal
-
 Netherlands
-
 New Zealand
-
 Nigeria
-
 North Macedonia
-
 Norway
-
 Oman
-
 Pakistan
-
 Palestine
-
 Panama
-
 Papua New Guinea
-
 Paraguay
-
 Peru
-
 Philippines
-
 Poland
-
 Portugal
-
 Puerto Rico
-
 Qatar
-
 Reunion
-
 Romania
-
 Rwanda
-
 Saudi Arabia
-
 Serbia
-
 Singapore
-
 Slovakia
-
 Slovenia
-
 Somalia
-
 South Africa
-
 Spain
-
 Sri Lanka
-
 Sweden
-
 Switzerland
-
 Syria
-
 Taiwan
-
 Tajikistan
-
 Tanzania
-
 Thailand
-
 Trinidad and Tobago
-
 Tunisia
-
 Turkey
-
 UAE
-
 Uganda
-
 Ukraine
-
 United Kingdom
-
United States
-
 Uruguay
-
 Uzbekistan
-
 Venezuela
-
 Vietnam
-
 Yemen
-
 Zambia
-
 Zimbabwe
- Forex
- Crypto












