

Earnings beat and restructuring coincide with weakness in Henry Schein stock

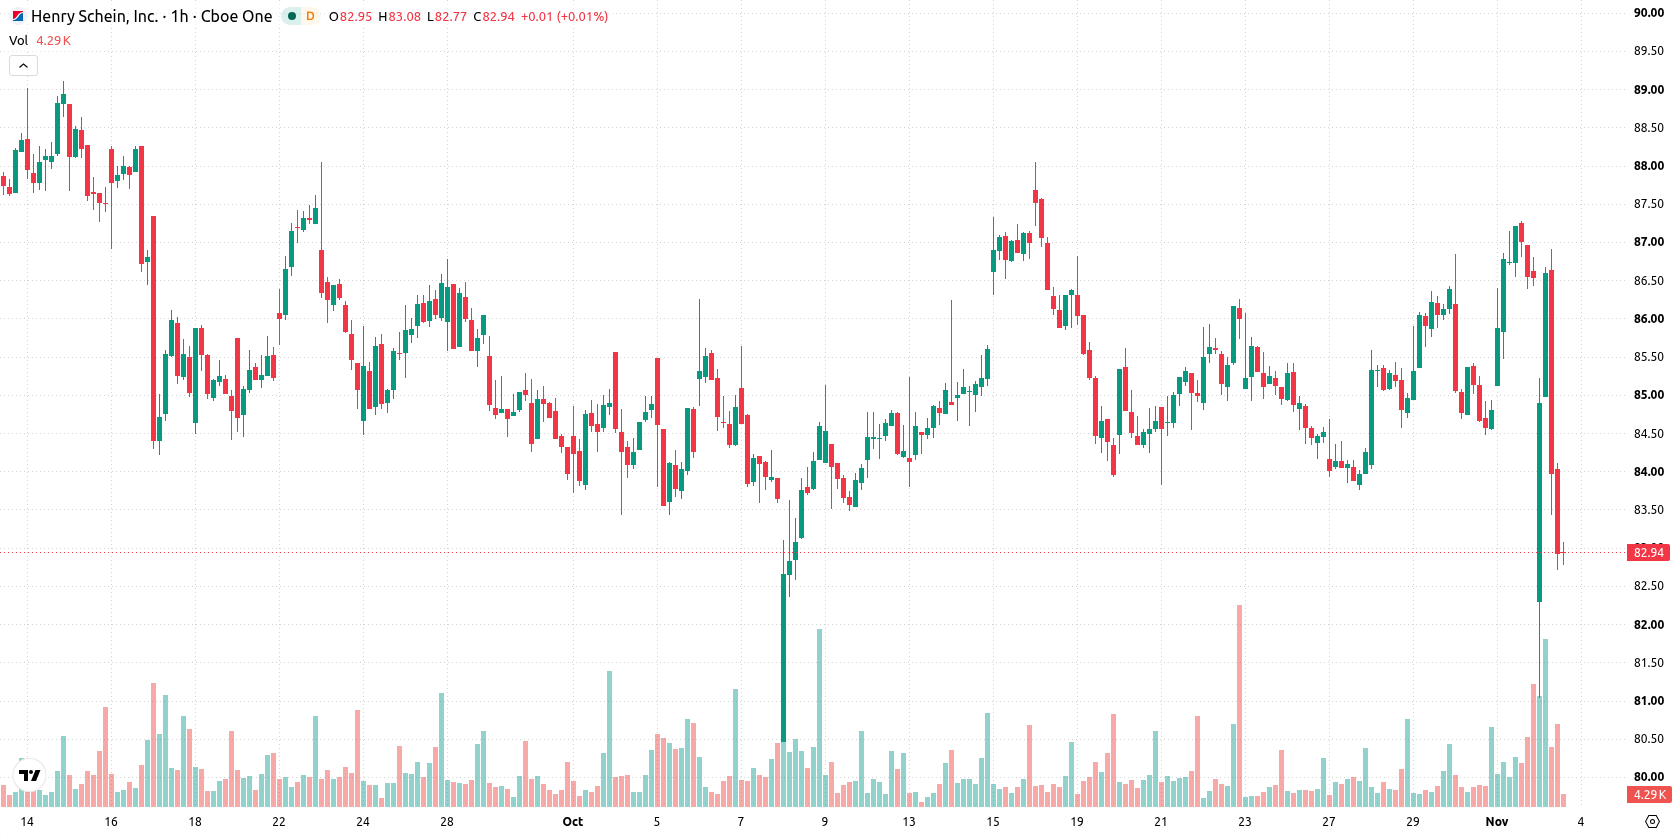
Henry Schein Inc. (HSIC) stock is trading at $82.96, down 4.1% for the day. The price is currently below its key short- and medium-term moving averages, while still holding above the long-term average.
 86.72
87.25
Highlights
- Henry Schein reported third-quarter 2026 revenue of $3.47 billion and non-GAAP EPS of $1.56, both above expectations.
- The company incurred $22 million in restructuring costs and repurchased 1.4 million shares for $125 million at $86.67 per share.
- Shares of Henry Schein trade below short- and medium-term moving averages, with the price likely to range between $81.44 and $87.83 in the coming days amid prevailing selling pressure.
Operational beat and buybacks overshadowed by persistent selling pressure
Henry Schein Inc. reported third-quarter 2026 revenue of $3.47 billion and non-GAAP earnings per share of $1.56, surpassing Wall Street expectations and highlighting operational outperformance, according to Gurufocus. The company also recorded $22 million in restructuring expenses during the period, reflecting ongoing efforts to improve its cost structure. Additionally, Henry Schein repurchased approximately 1.4 million shares for a total of $125 million at an average price of $86.67 per share in the quarter, as reported by Chartmill. These positive corporate developments have occurred as price action has remained under broader selling pressure.
Price weakness diverges from positive momentum near resistance
HSIC is trading below its MA-20 at $85.9 and MA-50 at $85.27, while remaining above its daily MA-200 at $81.1. The Ichimoku Kijun level at $85.88 serves as immediate resistance on the daily chart. Momentum indicators present a mixed picture: MACD and ADX reflect underlying buying strength, while RSI at 58.96, Stoch RSI at 68.15, and CCI at 77.09 are all within neutral ranges. Bull/Bear Power is modestly positive at 0.57, and the Awesome Oscillator signals some bullish momentum; however, today's session saw the stock gap lower at the open and remain weak with elevated volatility, evidencing divergence between price weakness and some positive momentum readings.
Range-bound bias holds as downside risk outweighs rebound odds
In the short term, HSIC's price is expected to consolidate within a volatility band of $81.44 to $87.83. Probability analysis points to a 68% likelihood of further downside movement, compared to 32% potential for an upside rebound. Baseline expectation is for range-bound activity, with resistance at $85.88 (Kijun level) as a key breakout point to the upside, while any sustained drop below the $81.44 support would likely accelerate further declines.
Earlier, analysts noted that Henry Schein shares were exhibiting range-bound movement amid mixed technical signals and heightened volatility. The latest price action now reflects a shift toward bearish pressure despite recent operational outperformance, making sustained support near $81.44 the critical level to watch for potential downside acceleration.






Latest Henry Schein Inc News




-
 Afghanistan
-
 Albania
-
 Algeria
-
 Angola
-
 Argentina
-
 Armenia
-
 Australia
-
 Austria
-
 Azerbaijan
-
 Bahamas
-
 Bahrain
-
 Bangladesh
-
 Belarus
-
 Belgium
-
 Bolivia
-
 Botswana
-
 Brazil
-
 Brunei
-
 Bulgaria
-
 Cambodia
-
 Cameroon
-
 Canada
-
 Chile
-
 China
-
 Colombia
-
 Congo
-
 Costa Rica
-
 Cote d'Ivoire
-
 Croatia
-
 Cuba
-
 Cyprus
-
 Czechia
-
 DR Congo
-
 Denmark
-
 Dominican Republic
-
 Ecuador
-
 Egypt
-
 El Salvador
-
 Estonia
-
 Eswatini
-
 Ethiopia
-
 Finland
-
 France
-
 Georgia
-
 Germany
-
 Ghana
-
 Greece
-
 Haiti
-
 Hong Kong
-
 Hungary
-
 India
-
 Indonesia
-
 Iran, Islamic republic
-
 Iraq
-
 Ireland
-
 Israel
-
 Italy
-
 Jamaica
-
 Japan
-
 Jordan
-
 Kazakhstan
-
 Kenya
-
 Korea
-
 Kuwait
-
 Kyrgyzstan
-
 Laos
-
 Latvia
-
 Lebanon
-
 Lesotho
-
 Libya
-
 Lithuania
-
 Luxembourg
-
 Madagascar
-
 Malaysia
-
 Malta
-
 Mauritius
-
 Mexico
-
 Moldova
-
 Mongolia
-
 Montenegro
-
 Morocco
-
 Mozambique
-
 Myanmar
-
 Namibia
-
 Nepal
-
 Netherlands
-
 New Zealand
-
 Nigeria
-
 North Macedonia
-
 Norway
-
 Oman
-
 Pakistan
-
 Palestine
-
 Panama
-
 Papua New Guinea
-
 Paraguay
-
 Peru
-
 Philippines
-
 Poland
-
 Portugal
-
 Puerto Rico
-
 Qatar
-
 Reunion
-
 Romania
-
 Rwanda
-
 Saudi Arabia
-
 Serbia
-
 Singapore
-
 Slovakia
-
 Slovenia
-
 Somalia
-
 South Africa
-
 Spain
-
 Sri Lanka
-
 Sweden
-
 Switzerland
-
 Syria
-
 Taiwan
-
 Tajikistan
-
 Tanzania
-
 Thailand
-
 Trinidad and Tobago
-
 Tunisia
-
 Turkey
-
 UAE
-
 Uganda
-
 Ukraine
-
 United Kingdom
-
United States
-
 Uruguay
-
 Uzbekistan
-
 Venezuela
-
 Vietnam
-
 Yemen
-
 Zambia
-
 Zimbabwe
- Forex
- Crypto












