

Vertex Pharmaceuticals shares technical analysis: Weak momentum signals persist as downward price move continues

Vertex Pharmaceuticals (VRTX) stock is trading at $532.03 after a daily decline of 3.82%, with the price positioned below its key short- and medium-term moving averages.
 548.76
565.83
Highlights
- Vertex Pharmaceuticals reported third-quarter 2026 revenue of $3.44 billion, a 12% increase year over year, and raised its full-year revenue guidance.
- The company completed a $9 billion acquisition of Crinetics Pharmaceuticals in September 2026, adding a new commercial pillar in rare endocrine diseases.
- Shares of Vertex stock fell 3.82% to $532.03 with strong selling pressure; technicals indicate ongoing downside momentum and an expected range of $512.8 to $551.26.
Revenue boost from Crinetics deal offset by higher costs and pressure
Vertex Pharmaceuticals reported third-quarter 2026 revenue of $3.44 billion, up 12% from the prior year, and raised its full-year revenue guidance following its completed acquisition of Crinetics Pharmaceuticals, according to News Vrtx. In September 2026, the company finalized its approximately $9 billion purchase of Crinetics Pharmaceuticals, establishing a new commercial pillar in rare endocrine diseases as reported by TradingKey. While quarterly revenue growth benefited from continued expansion of its cystic fibrosis franchise and the addition of the Crinetics portfolio, Financialcontent noted that operating expenses also rose due to acquisition and development costs, though price action has remained under broader selling pressure.
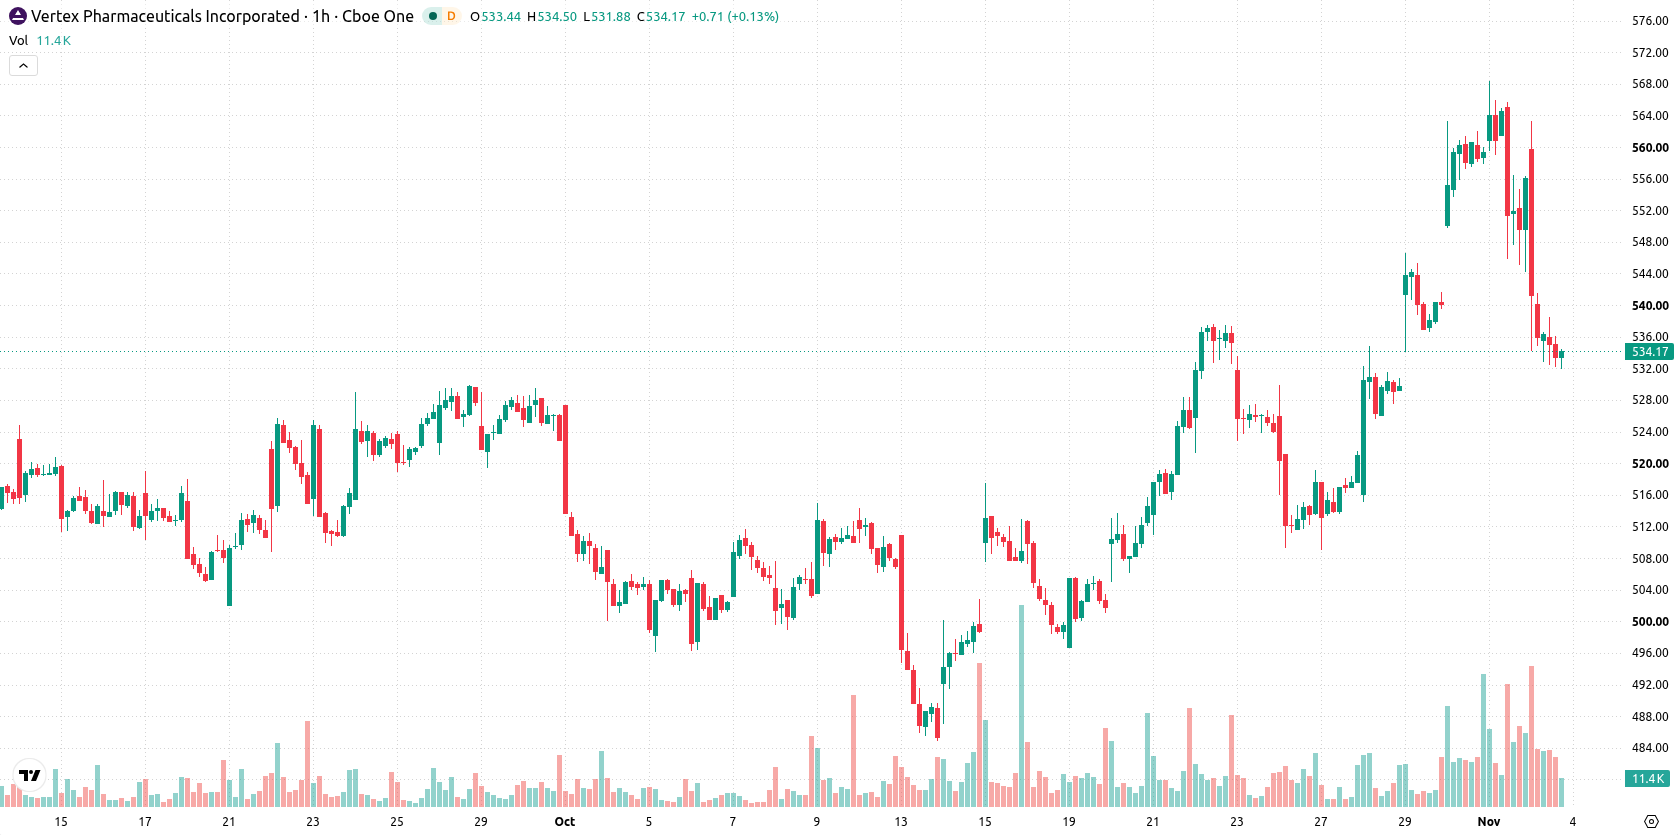
Neutral momentum persists as sellers dominate and oversold signals appear
On the hourly chart, VRTX is trading below both the MA-20 and MA-50, while on the daily timeframe it remains above the MA-200 level. The Ichimoku Kijun stands at $550.53, marking immediate resistance. The ADX signals a sell bias, and MACD is neutral, reflecting weak momentum. While RSI also remains neutral, both Stoch RSI and CCI are in the oversold zone, highlighting possible short-term rebound potential, but with sellers retaining control as indicated by negative Bull/Bear Power.
Downside favored as volatility bands define near-term range
In the coming days, VRTX is likely to fluctuate between $512.8 and $551.26, a volatility band relative to current levels. A 56% probability favors a downward price move, while a rebound remains possible with a 44% chance. Sustained trading within this range may lead to a period of sideways consolidation; a breakout above $550.53 would flag a bullish reversal, while a breakdown below $512.8 would reinforce ongoing bearish momentum.
Previously it was reported that Vertex Pharmaceuticals maintained robust revenue growth and a broadly bullish technical outlook despite experiencing heightened volatility and selling pressure. The current setup underscores ongoing consolidation and weak momentum, with traders advised to monitor $550.53 as a potential breakout level that could signal a shift back toward bullish reversal territory.






Latest Vertex Pharmaceuticals News




-
 Afghanistan
-
 Albania
-
 Algeria
-
 Angola
-
 Argentina
-
 Armenia
-
 Australia
-
 Austria
-
 Azerbaijan
-
 Bahamas
-
 Bahrain
-
 Bangladesh
-
 Belarus
-
 Belgium
-
 Bolivia
-
 Botswana
-
 Brazil
-
 Brunei
-
 Bulgaria
-
 Cambodia
-
 Cameroon
-
 Canada
-
 Chile
-
 China
-
 Colombia
-
 Congo
-
 Costa Rica
-
 Cote d'Ivoire
-
 Croatia
-
 Cuba
-
 Cyprus
-
 Czechia
-
 DR Congo
-
 Denmark
-
 Dominican Republic
-
 Ecuador
-
 Egypt
-
 El Salvador
-
 Estonia
-
 Eswatini
-
 Ethiopia
-
 Finland
-
 France
-
 Georgia
-
 Germany
-
 Ghana
-
 Greece
-
 Haiti
-
 Hong Kong
-
 Hungary
-
 India
-
 Indonesia
-
 Iran, Islamic republic
-
 Iraq
-
 Ireland
-
 Israel
-
 Italy
-
 Jamaica
-
 Japan
-
 Jordan
-
 Kazakhstan
-
 Kenya
-
 Korea
-
 Kuwait
-
 Kyrgyzstan
-
 Laos
-
 Latvia
-
 Lebanon
-
 Lesotho
-
 Libya
-
 Lithuania
-
 Luxembourg
-
 Madagascar
-
 Malaysia
-
 Malta
-
 Mauritius
-
 Mexico
-
 Moldova
-
 Mongolia
-
 Montenegro
-
 Morocco
-
 Mozambique
-
 Myanmar
-
 Namibia
-
 Nepal
-
 Netherlands
-
 New Zealand
-
 Nigeria
-
 North Macedonia
-
 Norway
-
 Oman
-
 Pakistan
-
 Palestine
-
 Panama
-
 Papua New Guinea
-
 Paraguay
-
 Peru
-
 Philippines
-
 Poland
-
 Portugal
-
 Puerto Rico
-
 Qatar
-
 Reunion
-
 Romania
-
 Rwanda
-
 Saudi Arabia
-
 Serbia
-
 Singapore
-
 Slovakia
-
 Slovenia
-
 Somalia
-
 South Africa
-
 Spain
-
 Sri Lanka
-
 Sweden
-
 Switzerland
-
 Syria
-
 Taiwan
-
 Tajikistan
-
 Tanzania
-
 Thailand
-
 Trinidad and Tobago
-
 Tunisia
-
 Turkey
-
 UAE
-
 Uganda
-
 Ukraine
-
 United Kingdom
-
United States
-
 Uruguay
-
 Uzbekistan
-
 Venezuela
-
 Vietnam
-
 Yemen
-
 Zambia
-
 Zimbabwe
- Forex
- Crypto












