

AstraZeneca beats Q3 earnings and reconfirms guidance: AZN consolidates near GBX13,702 support

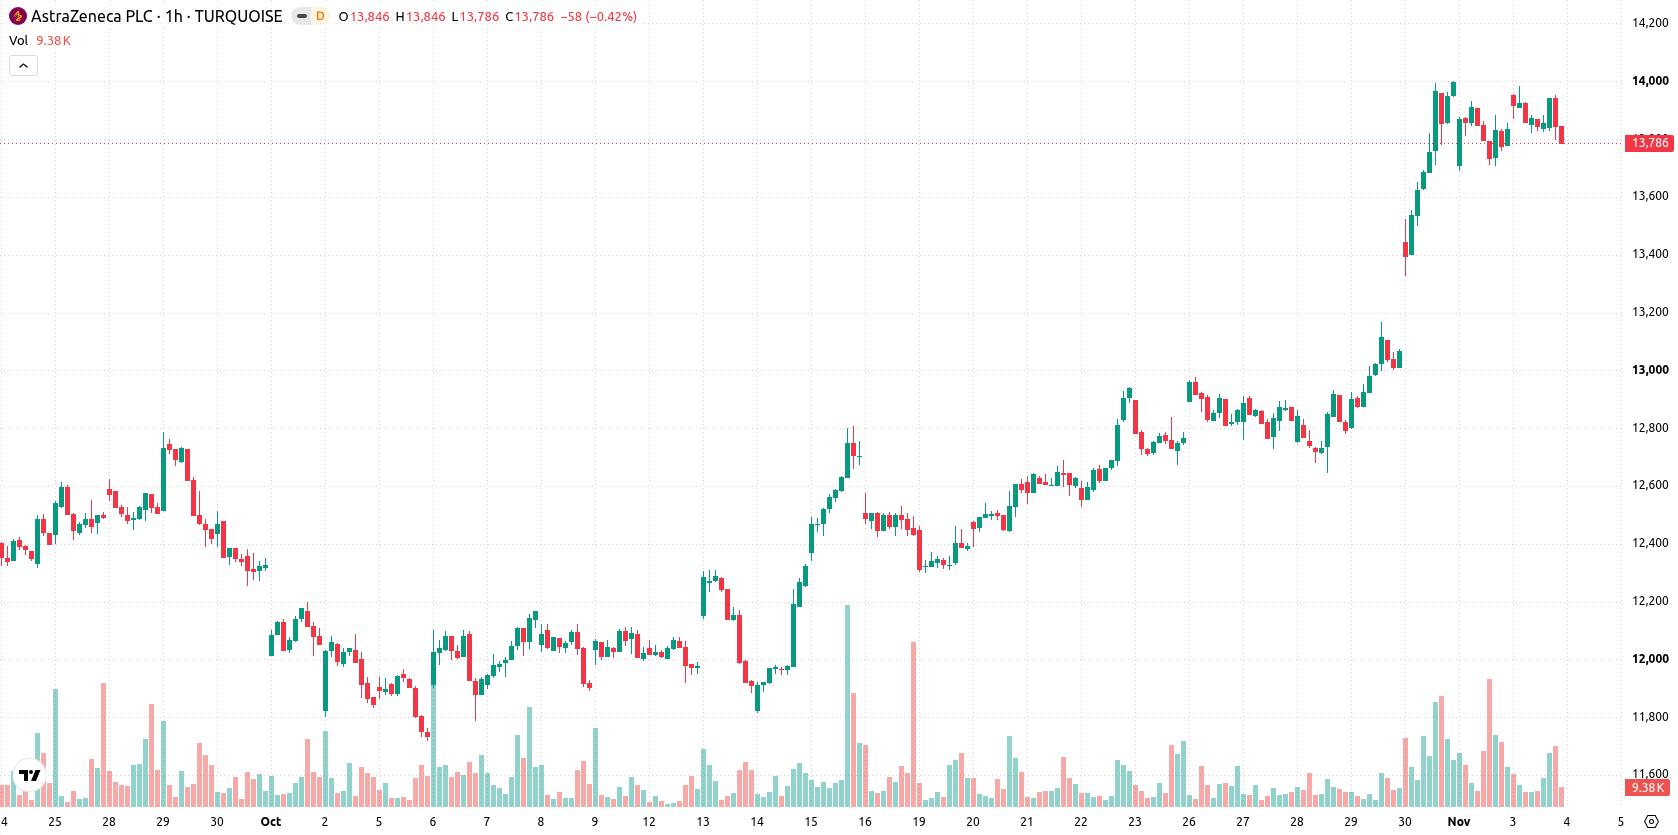
AstraZeneca (AZN) stock is trading at GBX13,788, posting a modest decline for the session. The current price is situated below its short-term averages, while remaining above both medium- and long-term trend levels.
 13538.00
14222.00
Highlights
- AstraZeneca reported Q3 2026 core EPS of $2.79 and revenue of $16.2 billion, exceeding profit expectations.
- The company reaffirmed its full-year guidance and initiated a $1.5 billion annual savings plan, discontinuing select early-stage cancer programs.
- Shares of AstraZeneca face near-term selling pressure but are expected to trade between GBX13,179 and GBX14,396 over the next several days, with momentum signals mixed.
Stronger outlook as earnings beat and cost cuts counter selling
AstraZeneca exceeded profit expectations for Q3 2026, reporting core EPS of $2.79 and revenue of $16.2 billion, which highlighted improvements in both earnings quality and operational execution. The company also reconfirmed its full-year guidance, reducing uncertainty about near-term financial outcomes and providing greater confidence to market participants. Further, AstraZeneca introduced a $1.5 billion per year savings programme, undertaking cost-cutting initiatives and discontinuing select early-stage cancer programs to improve cost structure and potentially enhance margins. Together, these actions have reinforced the company's financial position, though price action has remained under broader selling pressure.
Mixed momentum as bullish signals diverge with neutral oscillators
AZN/GBX is trading below the MA-20, with immediate support identified at the Ichimoku Kijun level of GBX13,702. The MA-50 on the hourly chart and the MA-200 on the daily remain intact below the current price. Momentum signals are mixed: MACD provides a strong buy indication alongside a buy reading from ADX, while RSI and CCI hold in neutral territory and Stoch RSI registers as oversold. Intraday Bull/Bear Power is modestly positive, but the price is near today's lows following a 104-point opening gap and subdued volatility, reflecting a divergence between bullish momentum indicators and the hesitancy implied by oscillators and price location.
Sideways scenario as upward bias faces defined range
For the next several sessions, AZN is anticipated to trade within a range of GBX13,179 to GBX14,396. There is a 59% probability of an upward move, making a further decline less likely over the short-term horizon. The baseline expectation is for a sideways pattern to develop inside this volatility band. A decisive break above the upper resistance could open a path toward the top end of the range, whereas sustained closes below immediate support at the Ichimoku Kijun increase the risk of a move toward the lower end of the corridor.
Earlier, analysts noted that AstraZeneca’s stock maintained a bullish technical setup, supported by strong earnings and restructuring initiatives. The current analysis builds on this by highlighting a divergence between price action and momentum signals, with particular attention on the GBX13,702 support level as a critical juncture for near-term direction.









-
 Afghanistan
-
 Albania
-
 Algeria
-
 Angola
-
 Argentina
-
 Armenia
-
 Australia
-
 Austria
-
 Azerbaijan
-
 Bahamas
-
 Bahrain
-
 Bangladesh
-
 Belarus
-
 Belgium
-
 Bolivia
-
 Botswana
-
 Brazil
-
 Brunei
-
 Bulgaria
-
 Cambodia
-
 Cameroon
-
 Canada
-
 Chile
-
 China
-
 Colombia
-
 Congo
-
 Costa Rica
-
 Cote d'Ivoire
-
 Croatia
-
 Cuba
-
 Cyprus
-
 Czechia
-
 DR Congo
-
 Denmark
-
 Dominican Republic
-
 Ecuador
-
 Egypt
-
 El Salvador
-
 Estonia
-
 Eswatini
-
 Ethiopia
-
 Finland
-
 France
-
 Georgia
-
 Germany
-
 Ghana
-
 Greece
-
 Haiti
-
 Hong Kong
-
 Hungary
-
 India
-
 Indonesia
-
 Iran, Islamic republic
-
 Iraq
-
 Ireland
-
 Israel
-
 Italy
-
 Jamaica
-
 Japan
-
 Jordan
-
 Kazakhstan
-
 Kenya
-
 Korea
-
 Kuwait
-
 Kyrgyzstan
-
 Laos
-
 Latvia
-
 Lebanon
-
 Lesotho
-
 Libya
-
 Lithuania
-
 Luxembourg
-
 Madagascar
-
 Malaysia
-
 Malta
-
 Mauritius
-
 Mexico
-
 Moldova
-
 Mongolia
-
 Montenegro
-
 Morocco
-
 Mozambique
-
 Myanmar
-
 Namibia
-
 Nepal
-
 Netherlands
-
 New Zealand
-
 Nigeria
-
 North Macedonia
-
 Norway
-
 Oman
-
 Pakistan
-
 Palestine
-
 Panama
-
 Papua New Guinea
-
 Paraguay
-
 Peru
-
 Philippines
-
 Poland
-
 Portugal
-
 Puerto Rico
-
 Qatar
-
 Reunion
-
 Romania
-
 Rwanda
-
 Saudi Arabia
-
 Serbia
-
 Singapore
-
 Slovakia
-
 Slovenia
-
 Somalia
-
 South Africa
-
 Spain
-
 Sri Lanka
-
 Sweden
-
 Switzerland
-
 Syria
-
 Taiwan
-
 Tajikistan
-
 Tanzania
-
 Thailand
-
 Trinidad and Tobago
-
 Tunisia
-
 Turkey
-
 UAE
-
 Uganda
-
 Ukraine
-
 United Kingdom
-
United States
-
 Uruguay
-
 Uzbekistan
-
 Venezuela
-
 Vietnam
-
 Yemen
-
 Zambia
-
 Zimbabwe
- Forex
- Crypto












