

Caterpillar shares weekly forecast: Oversold signals build rebound potential as RSI and CCI drop sharply

Shares of Caterpillar, Inc. (CAT) are trading near $624 as support comes into focus after a stretched decline. With price action stabilizing in a tight range, attention shifts to whether the recent weakness can ease or the bearish trend will continue into the week ahead.
 566.45
628.07
Highlights
- Caterpillar stock edged up $1.04 over the week to $623.81 but remains below key moving averages.
- Technical indicators show persistent bearish pressure with oversold signals building the risk of a near-term rebound.
- Price is projected between $569.4 to $674.13 with 78% probability of further downside unless resistance at $720.2 breaks.
Valuation anxieties persist despite record sales and margin pressure signals
Caterpillar reported record third-quarter 2026 sales and a $78 billion backlog on November 1, 2026, but despite beating profit expectations, the stock declined as investors turned their attention to valuation concerns and ongoing margin pressure, according to Yahoo Finance. CEO Jim Umpleby noted that margins were currently at the low end of the targeted range. In corporate activity, Caterpillar completed its acquisition of the Fabick Cat dealership and continues to prioritize capital returns through dividends and share repurchases.
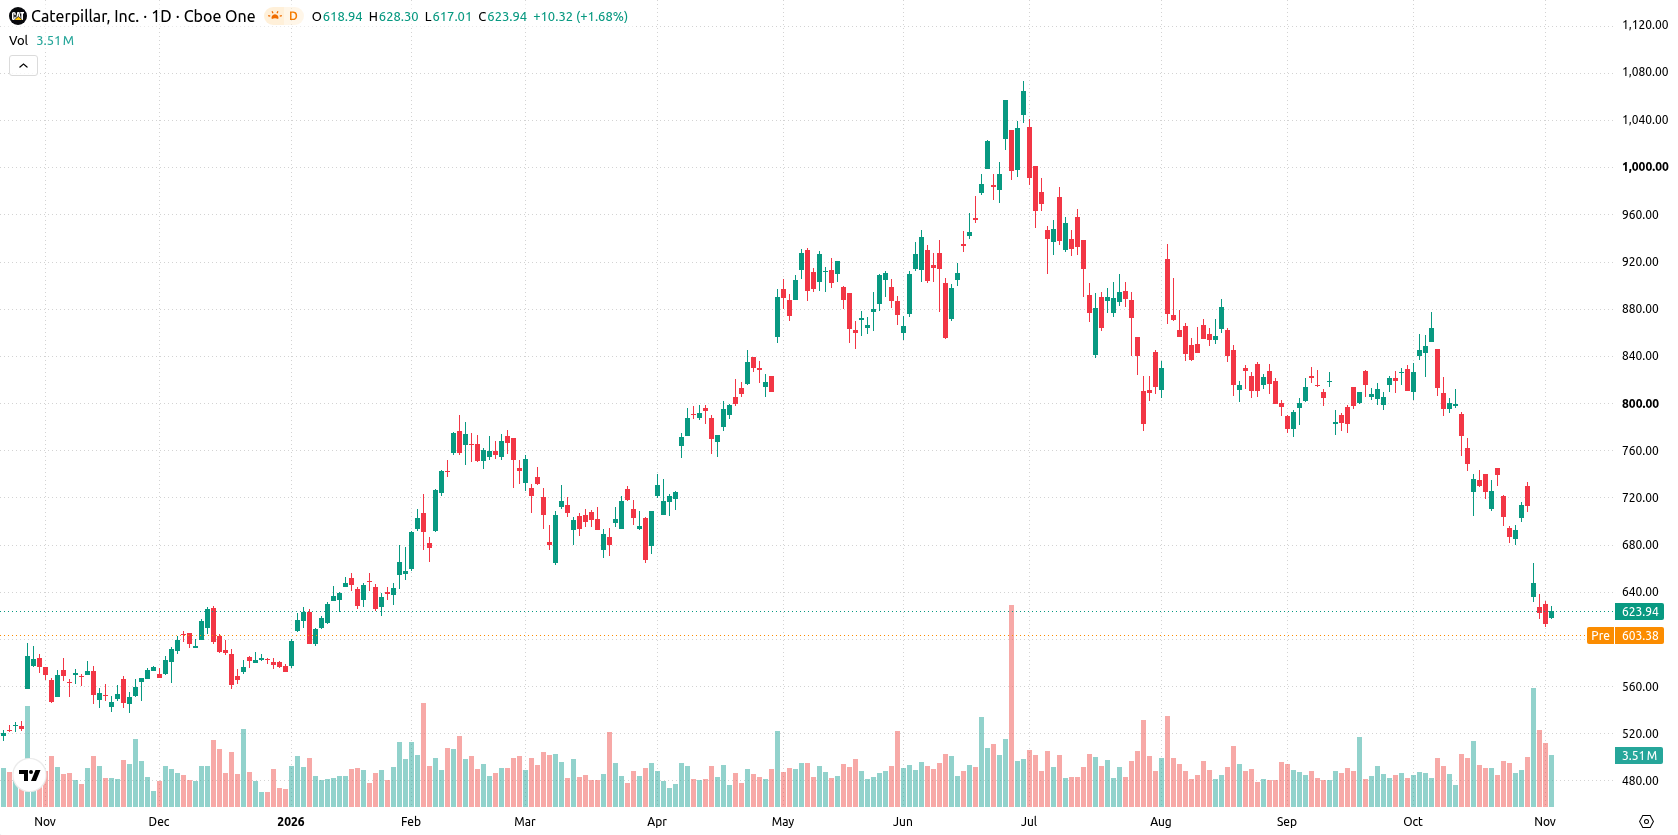
Oversold readings intensify as bearish momentum accelerates this week
On the daily chart, Caterpillar continues to trend lower, with price action anchored at the bottom of the recent weekly range. RSI at 26.16 and CCI at -139.32 both signal oversold conditions, suggesting selling may be stretched and a potential rebound risk is building. MACD and ADX both indicate persistent bearish momentum, while weekly volatility stands elevated at 18.45%. Nearest support is marked at $609.97, with initial resistance at $720.2 and additional resistance from the Ichimoku Kijun at $742.77.
Downside bias dominates forecast unless resistance threshold is reclaimed
For the next five trading days, the expected range is $569.4 to $674.13. The probability of a decrease is 78%, while the chance of an increase is just 22%. The base case calls for price action to remain pressured below resistance at $720.2. A move above this level would indicate a short-term bullish reversal. Sustained weakness below $609.97 opens further downside toward the lower boundary of the projected range.
Earlier, analysts noted that Caterpillar's strong fundamentals were overshadowed by persistent technical weakness and significant downside risks. The current analysis strengthens this outlook with fresh technical signals and volatility data, highlighting $609.97 as a key support level that traders should monitor closely for a potential breakdown or a short-term reversal.






Latest Caterpillar News




-
 Afghanistan
-
 Albania
-
 Algeria
-
 Angola
-
 Argentina
-
 Armenia
-
 Australia
-
 Austria
-
 Azerbaijan
-
 Bahamas
-
 Bahrain
-
 Bangladesh
-
 Belarus
-
 Belgium
-
 Bolivia
-
 Botswana
-
 Brazil
-
 Brunei
-
 Bulgaria
-
 Cambodia
-
 Cameroon
-
 Canada
-
 Chile
-
 China
-
 Colombia
-
 Congo
-
 Costa Rica
-
 Cote d'Ivoire
-
 Croatia
-
 Cuba
-
 Cyprus
-
 Czechia
-
 DR Congo
-
 Denmark
-
 Dominican Republic
-
 Ecuador
-
 Egypt
-
 El Salvador
-
 Estonia
-
 Eswatini
-
 Ethiopia
-
 Finland
-
 France
-
 Georgia
-
 Germany
-
 Ghana
-
 Greece
-
 Haiti
-
 Hong Kong
-
 Hungary
-
 India
-
 Indonesia
-
 Iran, Islamic republic
-
 Iraq
-
 Ireland
-
 Israel
-
 Italy
-
 Jamaica
-
 Japan
-
 Jordan
-
 Kazakhstan
-
 Kenya
-
 Korea
-
 Kuwait
-
 Kyrgyzstan
-
 Laos
-
 Latvia
-
 Lebanon
-
 Lesotho
-
 Libya
-
 Lithuania
-
 Luxembourg
-
 Madagascar
-
 Malaysia
-
 Malta
-
 Mauritius
-
 Mexico
-
 Moldova
-
 Mongolia
-
 Montenegro
-
 Morocco
-
 Mozambique
-
 Myanmar
-
 Namibia
-
 Nepal
-
 Netherlands
-
 New Zealand
-
 Nigeria
-
 North Macedonia
-
 Norway
-
 Oman
-
 Pakistan
-
 Palestine
-
 Panama
-
 Papua New Guinea
-
 Paraguay
-
 Peru
-
 Philippines
-
 Poland
-
 Portugal
-
 Puerto Rico
-
 Qatar
-
 Reunion
-
 Romania
-
 Rwanda
-
 Saudi Arabia
-
 Serbia
-
 Singapore
-
 Slovakia
-
 Slovenia
-
 Somalia
-
 South Africa
-
 Spain
-
 Sri Lanka
-
 Sweden
-
 Switzerland
-
 Syria
-
 Taiwan
-
 Tajikistan
-
 Tanzania
-
 Thailand
-
 Trinidad and Tobago
-
 Tunisia
-
 Turkey
-
 UAE
-
 Uganda
-
 Ukraine
-
 United Kingdom
-
United States
-
 Uruguay
-
 Uzbekistan
-
 Venezuela
-
 Vietnam
-
 Yemen
-
 Zambia
-
 Zimbabwe
- Forex
- Crypto












