

Amazon stock rises as buyer support fuels ongoing rally

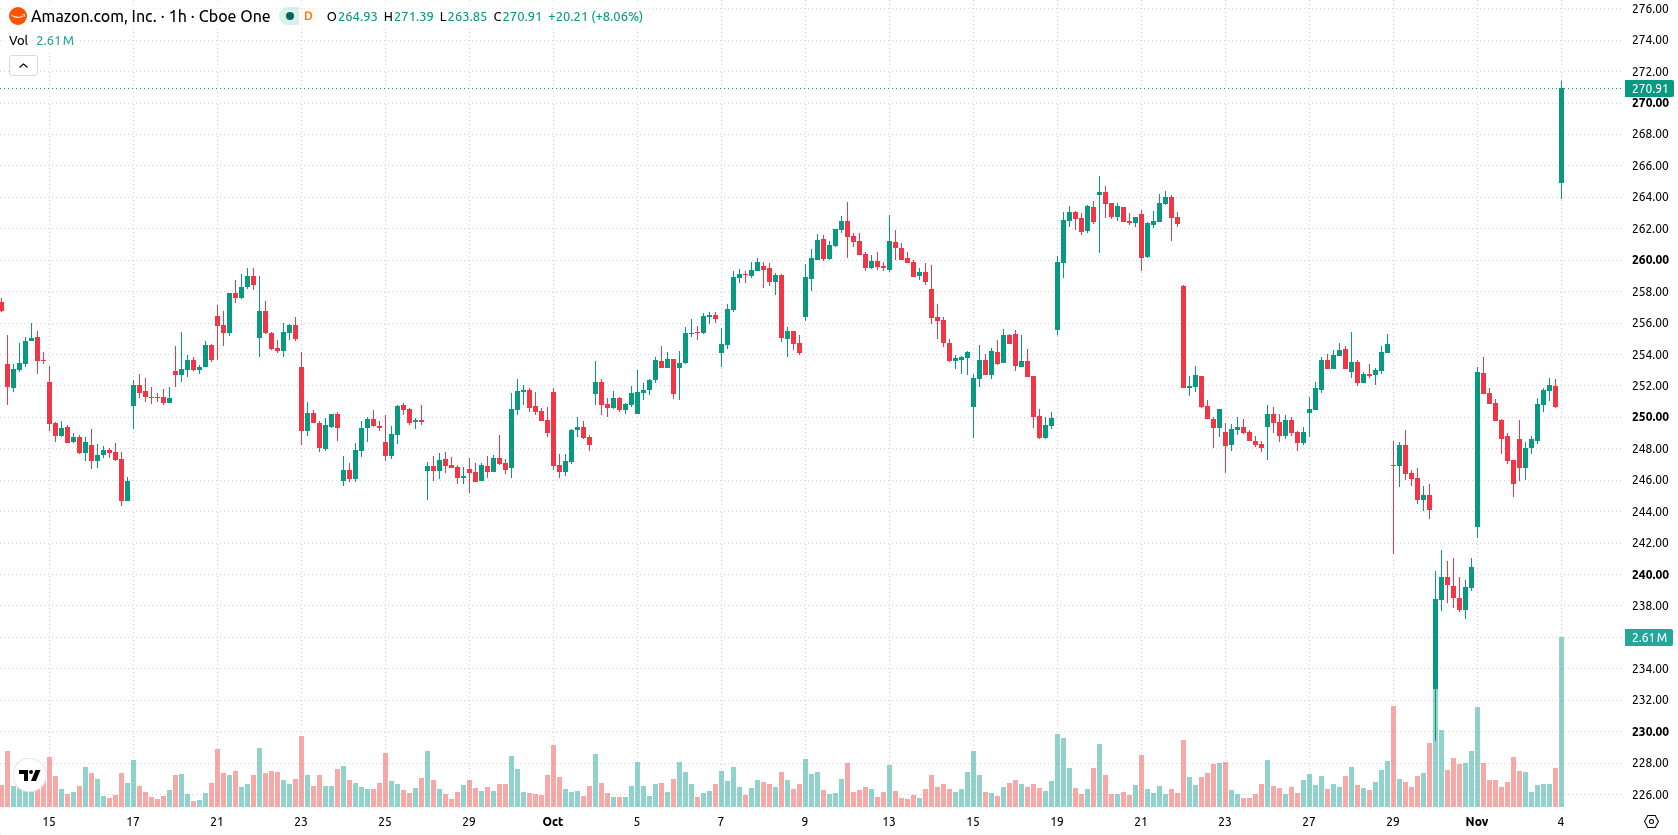
Amazon (AMZN) stock is trading at $270.13 after a daily move of 7.75%, closing near today's high. Price action currently sits above its key short and long-term moving averages.
 271.46
253.81
Highlights
- Amazon reported record third-quarter 2026 revenue of $201.94 billion with a 13.9% operating margin and 61% growth in operating income.
- Amazon Web Services posted its fastest revenue growth in nearly five years, up 39.3% to $46.0 billion, and the company launched a climate tech accelerator.
- Shares of Amazon advanced 7.75% to $270.13, with technicals signaling strong bullish momentum and a projected 2–3 day range of $251.38 to $278.24.
Robust earnings and cloud growth fuel renewed investor demand
Amazon reported record third-quarter 2026 revenue of $201.94 billion, indicating robust sales metrics and underlying business momentum, according to Seeking Alpha. The company achieved a 13.9% operating margin and 61% year-over-year growth in operating income, confirming improved profitability and operational leverage after addressing concerns over free cash flow and capital expenditures. Business momentum was further supported by Amazon Web Services delivering its fastest revenue growth in nearly five years, up 39.3% to $46.0 billion, while the launch of the Amazon Sustainability Deep Tech Accelerator on November 3 marked a strategic push into advanced climate technologies. These developments together reinforced demand for Amazon shares amid a fundamentally positive corporate backdrop.
Overbought signals emerge as bullish momentum tests resistance
On the technical front, AMZN is trading above the MA-20 at $248.01, the MA-50 at $248.97, and the long-term MA-200 at $243.49 on the H1 chart. The Ichimoku Kijun at $249.95 establishes immediate support. Resistance is now set higher as the stock extends its rally, with MACD and ADX both confirming ongoing bullish momentum. Overbought conditions prevail on the RSI, Stoch RSI, and CCI, highlighting elevated risk for a near-term pullback. Bull/Bear Power remains strongly positive at 18.62, and the Awesome Oscillator supports the prevailing uptrend.
Range trade likely as volatility defines near-term price action
In the short term, AMZN is expected to consolidate within a range of $251.38 to $278.24, reflecting the current volatility band relative to price levels. The most probable scenario is for the price to hold within this range. A bullish scenario could see AMZN break above resistance and extend to new highs, while a downside move below support would increase the probability of a deeper, albeit less likely, correction.
Earlier, analysts noted that Amazon and Walmart are adapting their retail media strategies in response to the growing impact of AI shopping agents on e-commerce discovery and advertising models. With Amazon's continued operational momentum and record-setting financial performance, traders should monitor the current $251.38 to $278.24 range for potential breakout or correction signals as the market digests evolving business and technological dynamics.






Latest Amazon News





-
 Afghanistan
-
 Albania
-
 Algeria
-
 Angola
-
 Argentina
-
 Armenia
-
 Australia
-
 Austria
-
 Azerbaijan
-
 Bahamas
-
 Bahrain
-
 Bangladesh
-
 Belarus
-
 Belgium
-
 Bolivia
-
 Botswana
-
 Brazil
-
 Brunei
-
 Bulgaria
-
 Cambodia
-
 Cameroon
-
 Canada
-
 Chile
-
 China
-
 Colombia
-
 Congo
-
 Costa Rica
-
 Cote d'Ivoire
-
 Croatia
-
 Cuba
-
 Cyprus
-
 Czechia
-
 DR Congo
-
 Denmark
-
 Dominican Republic
-
 Ecuador
-
 Egypt
-
 El Salvador
-
 Estonia
-
 Eswatini
-
 Ethiopia
-
 Finland
-
 France
-
 Georgia
-
 Germany
-
 Ghana
-
 Greece
-
 Haiti
-
 Hong Kong
-
 Hungary
-
 India
-
 Indonesia
-
 Iran, Islamic republic
-
 Iraq
-
 Ireland
-
 Israel
-
 Italy
-
 Jamaica
-
 Japan
-
 Jordan
-
 Kazakhstan
-
 Kenya
-
 Korea
-
 Kuwait
-
 Kyrgyzstan
-
 Laos
-
 Latvia
-
 Lebanon
-
 Lesotho
-
 Libya
-
 Lithuania
-
 Luxembourg
-
 Madagascar
-
 Malaysia
-
 Malta
-
 Mauritius
-
 Mexico
-
 Moldova
-
 Mongolia
-
 Montenegro
-
 Morocco
-
 Mozambique
-
 Myanmar
-
 Namibia
-
 Nepal
-
 Netherlands
-
 New Zealand
-
 Nigeria
-
 North Macedonia
-
 Norway
-
 Oman
-
 Pakistan
-
 Palestine
-
 Panama
-
 Papua New Guinea
-
 Paraguay
-
 Peru
-
 Philippines
-
 Poland
-
 Portugal
-
 Puerto Rico
-
 Qatar
-
 Reunion
-
 Romania
-
 Rwanda
-
 Saudi Arabia
-
 Serbia
-
 Singapore
-
 Slovakia
-
 Slovenia
-
 Somalia
-
 South Africa
-
 Spain
-
 Sri Lanka
-
 Sweden
-
 Switzerland
-
 Syria
-
 Taiwan
-
 Tajikistan
-
 Tanzania
-
 Thailand
-
 Trinidad and Tobago
-
 Tunisia
-
 Turkey
-
 UAE
-
 Uganda
-
 Ukraine
-
 United Kingdom
-
United States
-
 Uruguay
-
 Uzbekistan
-
 Venezuela
-
 Vietnam
-
 Yemen
-
 Zambia
-
 Zimbabwe
- Forex
- Crypto












