

Will GOOGL extend its upward move amid strong revenue and Google Cloud growth?

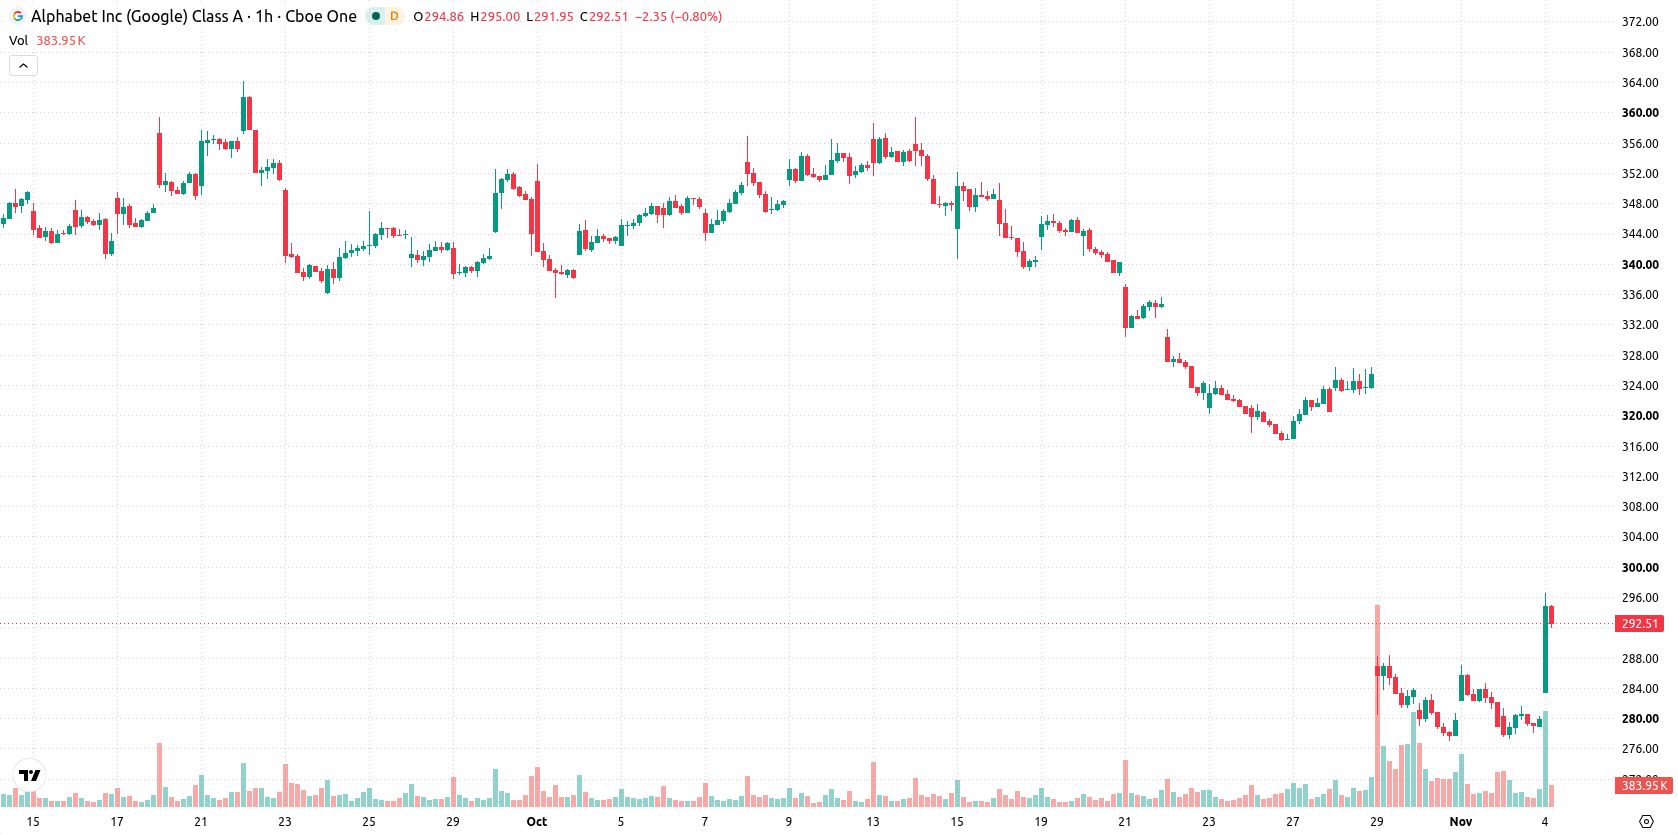
Alphabet (GOOGL) stock is trading at $292.68, up 4.52% on the day. The price is positioned above its short-term moving average but remains under longer-term trend levels, reflecting intraday momentum and moderate volatility.
 283.14
295.43
Highlights
- Alphabet reported quarterly revenue up 25% year over year to $127.6 billion with strong growth in Google Cloud.
- The company faces near-term volatility from disappointment in its Gemini AI update and an ongoing securities class action lawsuit.
- GOOGL stock trades with short-term strength inside a broader bearish structure, with consolidation expected in the $287.60 to $297.76 range.
Revenue growth rekindles demand amid Gemini AI lawsuit concerns
Alphabet reported a robust 25% year-over-year revenue increase to $127.6 billion in its most recent quarterly results, underscoring strong growth in Google Cloud and sustained technology segment expansion, according to Fool. This topline performance has helped to revive buying interest, partly offsetting concerns about slower momentum in Google Search and heightened competition in artificial intelligence services. At the same time, the company is contending with recent disappointment surrounding an update to Google's Gemini AI training data and a resulting securities class action lawsuit, as reported by Prnewswire, which may add to near-term volatility but has not derailed the fundamental narrative.
Near-term gains face resistance as technical signals show mixed momentum
GOOGL is trading above the MA-20 but remains below both the MA-50 and MA-200, delineating a short-term upward push against broader trend resistance. The Ichimoku Kijun level at $283.71 serves as the closest support. MACD signals Strong Sell while ADX continues to indicate buy conditions, presenting a divergence in trend signals. RSI is neutral, with Stochastic RSI and CCI in overbought zones, pointing to possible overheating, though no clear reversal is confirmed. Bull/Bear Power stands positive at 8.29, reflecting robust buyer presence intraday, while the Awesome Oscillator remains neutral and does not confirm a prevailing direction.
Sideways range anticipated as downside risk exceeds breakout odds
Looking ahead, GOOGL is expected to consolidate within the $287.60 to $297.76 range over the next several sessions. The probability of further gains is estimated at 45%, with a higher likelihood of a move lower at 55%. The baseline scenario projects continued sideways movement in this volatility band. A breakout above resistance could drive a renewed test of upper levels, whereas a decisive drop below support would increase downside risk.
Earlier, analysts noted that persistent downside momentum in Alphabet shares was being driven by AI investment pressures and weaker core business performance. The latest developments introduce competing signals, and with GOOGL now oscillating between short-term upside and broader resistance, traders should monitor for a breakout above or below the prevailing $287.60–$297.76 range to define the next directional move.











-
 Afghanistan
-
 Albania
-
 Algeria
-
 Angola
-
 Argentina
-
 Armenia
-
 Australia
-
 Austria
-
 Azerbaijan
-
 Bahamas
-
 Bahrain
-
 Bangladesh
-
 Belarus
-
 Belgium
-
 Bolivia
-
 Botswana
-
 Brazil
-
 Brunei
-
 Bulgaria
-
 Cambodia
-
 Cameroon
-
 Canada
-
 Chile
-
 China
-
 Colombia
-
 Congo
-
 Costa Rica
-
 Cote d'Ivoire
-
 Croatia
-
 Cuba
-
 Cyprus
-
 Czechia
-
 DR Congo
-
 Denmark
-
 Dominican Republic
-
 Ecuador
-
 Egypt
-
 El Salvador
-
 Estonia
-
 Eswatini
-
 Ethiopia
-
 Finland
-
 France
-
 Georgia
-
 Germany
-
 Ghana
-
 Greece
-
 Haiti
-
 Hong Kong
-
 Hungary
-
 India
-
 Indonesia
-
 Iran, Islamic republic
-
 Iraq
-
 Ireland
-
 Israel
-
 Italy
-
 Jamaica
-
 Japan
-
 Jordan
-
 Kazakhstan
-
 Kenya
-
 Korea
-
 Kuwait
-
 Kyrgyzstan
-
 Laos
-
 Latvia
-
 Lebanon
-
 Lesotho
-
 Libya
-
 Lithuania
-
 Luxembourg
-
 Madagascar
-
 Malaysia
-
 Malta
-
 Mauritius
-
 Mexico
-
 Moldova
-
 Mongolia
-
 Montenegro
-
 Morocco
-
 Mozambique
-
 Myanmar
-
 Namibia
-
 Nepal
-
 Netherlands
-
 New Zealand
-
 Nigeria
-
 North Macedonia
-
 Norway
-
 Oman
-
 Pakistan
-
 Palestine
-
 Panama
-
 Papua New Guinea
-
 Paraguay
-
 Peru
-
 Philippines
-
 Poland
-
 Portugal
-
 Puerto Rico
-
 Qatar
-
 Reunion
-
 Romania
-
 Rwanda
-
 Saudi Arabia
-
 Serbia
-
 Singapore
-
 Slovakia
-
 Slovenia
-
 Somalia
-
 South Africa
-
 Spain
-
 Sri Lanka
-
 Sweden
-
 Switzerland
-
 Syria
-
 Taiwan
-
 Tajikistan
-
 Tanzania
-
 Thailand
-
 Trinidad and Tobago
-
 Tunisia
-
 Turkey
-
 UAE
-
 Uganda
-
 Ukraine
-
 United Kingdom
-
United States
-
 Uruguay
-
 Uzbekistan
-
 Venezuela
-
 Vietnam
-
 Yemen
-
 Zambia
-
 Zimbabwe
- Forex
- Crypto












