

Chevron sees ETF outflows of $107.4 million: CVX remains under seller pressure

Chevron (CVX) stock is trading at $218.43, down 3.04% on the day. The price remains below its short- and medium-term moving averages but is above the long-term average, indicating persistent near-term weakness amid longer-term support.
 215.06
232.85
Highlights
- ETFs sold $107.4 million worth of Chevron shares on October 30, 2026, sharply increasing the available float.
- This significant ETF outflow reduced short-term institutional demand and contributed to additional selling pressure on Chevron stock.
- Chevron stock trades below key short- and medium-term moving averages with momentum indicators signaling strong downside and an expected range of $213.07 to $223.79.
ETF outflows intensify selling as liquidity drops
ETFs were net sellers of $107.4 million worth of Chevron shares on October 30, 2026, according to Gurufocus. This substantial outflow from ETF vehicles increased the available float and diminished institutional demand for Chevron in the short term, contributing to additional selling pressure in the market. The move likely weighed on liquidity conditions and may have amplified recent downside price action.
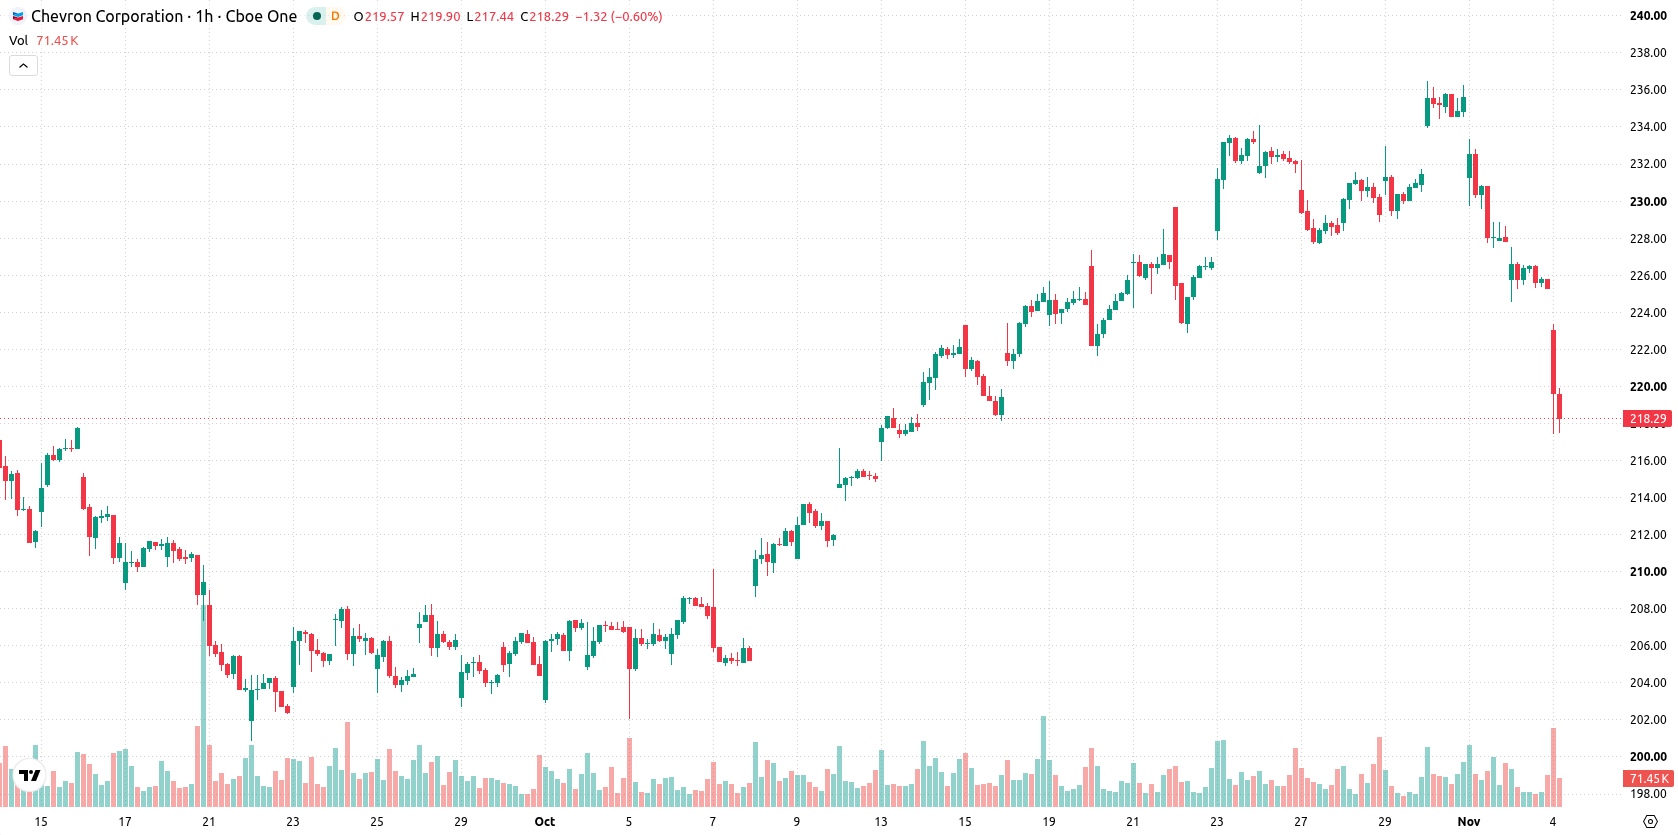
Seller momentum dominates as price tests key resistance and oversold signals
On the H1 timeframe, CVX has remained below the MA-20 at $229.09 and the MA-50 at $230.11, while sitting above the MA-200 at $193.94. The Ichimoku Kijun line at $226.95 serves as immediate resistance. Momentum readings are weak: both MACD and ADX signal a sell, and Bull/Bear Power sits at -4.3 for the session, consistent with seller dominance. Key oscillators—RSI, Stoch RSI, and CCI—are all confirmed as oversold, though the Awesome Oscillator remains neutral and does not reinforce the downside bias. Price is near the session low, with moderate volatility observed.
Elevated downside risk amid constrained volatility and bearish bias
In the short term, the anticipated trading range for CVX is $213.07 to $223.79, reflecting typical volatility relative to current levels. Downside risk appears elevated, with a much higher probability of the price moving lower than staging a rally. The baseline scenario calls for sideways action within this band, though a break above $226.95 would be needed to trigger a bullish reversal. Alternatively, a close below $213.07 may accelerate bearish momentum.
Earlier, analysts noted that Chevron's resilient technical setup had been supported by strong earnings performance despite ongoing selling pressure. The current article signals a change in the situation, as recent ETF outflows and persistently weak momentum indicators increase downside risk, making a break below $213.07 a key level to watch for accelerating bearish action.











-
 Afghanistan
-
 Albania
-
 Algeria
-
 Angola
-
 Argentina
-
 Armenia
-
 Australia
-
 Austria
-
 Azerbaijan
-
 Bahamas
-
 Bahrain
-
 Bangladesh
-
 Belarus
-
 Belgium
-
 Bolivia
-
 Botswana
-
 Brazil
-
 Brunei
-
 Bulgaria
-
 Cambodia
-
 Cameroon
-
 Canada
-
 Chile
-
 China
-
 Colombia
-
 Congo
-
 Costa Rica
-
 Cote d'Ivoire
-
 Croatia
-
 Cuba
-
 Cyprus
-
 Czechia
-
 DR Congo
-
 Denmark
-
 Dominican Republic
-
 Ecuador
-
 Egypt
-
 El Salvador
-
 Estonia
-
 Eswatini
-
 Ethiopia
-
 Finland
-
 France
-
 Georgia
-
 Germany
-
 Ghana
-
 Greece
-
 Haiti
-
 Hong Kong
-
 Hungary
-
 India
-
 Indonesia
-
 Iran, Islamic republic
-
 Iraq
-
 Ireland
-
 Israel
-
 Italy
-
 Jamaica
-
 Japan
-
 Jordan
-
 Kazakhstan
-
 Kenya
-
 Korea
-
 Kuwait
-
 Kyrgyzstan
-
 Laos
-
 Latvia
-
 Lebanon
-
 Lesotho
-
 Libya
-
 Lithuania
-
 Luxembourg
-
 Madagascar
-
 Malaysia
-
 Malta
-
 Mauritius
-
 Mexico
-
 Moldova
-
 Mongolia
-
 Montenegro
-
 Morocco
-
 Mozambique
-
 Myanmar
-
 Namibia
-
 Nepal
-
 Netherlands
-
 New Zealand
-
 Nigeria
-
 North Macedonia
-
 Norway
-
 Oman
-
 Pakistan
-
 Palestine
-
 Panama
-
 Papua New Guinea
-
 Paraguay
-
 Peru
-
 Philippines
-
 Poland
-
 Portugal
-
 Puerto Rico
-
 Qatar
-
 Reunion
-
 Romania
-
 Rwanda
-
 Saudi Arabia
-
 Serbia
-
 Singapore
-
 Slovakia
-
 Slovenia
-
 Somalia
-
 South Africa
-
 Spain
-
 Sri Lanka
-
 Sweden
-
 Switzerland
-
 Syria
-
 Taiwan
-
 Tajikistan
-
 Tanzania
-
 Thailand
-
 Trinidad and Tobago
-
 Tunisia
-
 Turkey
-
 UAE
-
 Uganda
-
 Ukraine
-
 United Kingdom
-
United States
-
 Uruguay
-
 Uzbekistan
-
 Venezuela
-
 Vietnam
-
 Yemen
-
 Zambia
-
 Zimbabwe
- Forex
- Crypto












