

Chevron stock weekly forecast: Sits near oversold territory with Stochastic RSI at zero

Shares of Chevron Corporation (CVX) are trading near $225 after falling around 4.5% over the past week, weighed down by strong but volatile trading action. Although buyers remain in control, all eyes turn to whether support can hold as strong corporate performance continues to offset broader downside momentum. The coming week will test if this resilience can persist as the earnings boost starts to fade.
 220.17
236.45
Highlights
- Shares of Chevron fell 4.45% over the past seven days to $225.25, moving to the bottom of the weekly range.
- The stock holds above key long-term averages, with trend signals mixed and short-term momentum pointing lower but oversold.
- Chevron is expected to trade between $220.23 and $232.04 in the next five sessions, with 68% probability of an increase inside this range.
Record U.S. refinery throughput drives upbeat quarter as restructuring looms
Chevron reported better-than-expected third quarter 2026 results, with adjusted EPS of $5.28 and revenue up about 36% year-over-year to $67.8 billion, according to Yahoo Finance. Management highlighted operational discipline, record U.S. refinery throughput, and growth in Venezuelan production as key contributors to the quarter's results. Chevron also announced plans for a non-cash after-tax restructuring loss of $3 to $4 billion in the fourth quarter due to the deconsolidation of Hess Midstream assets.
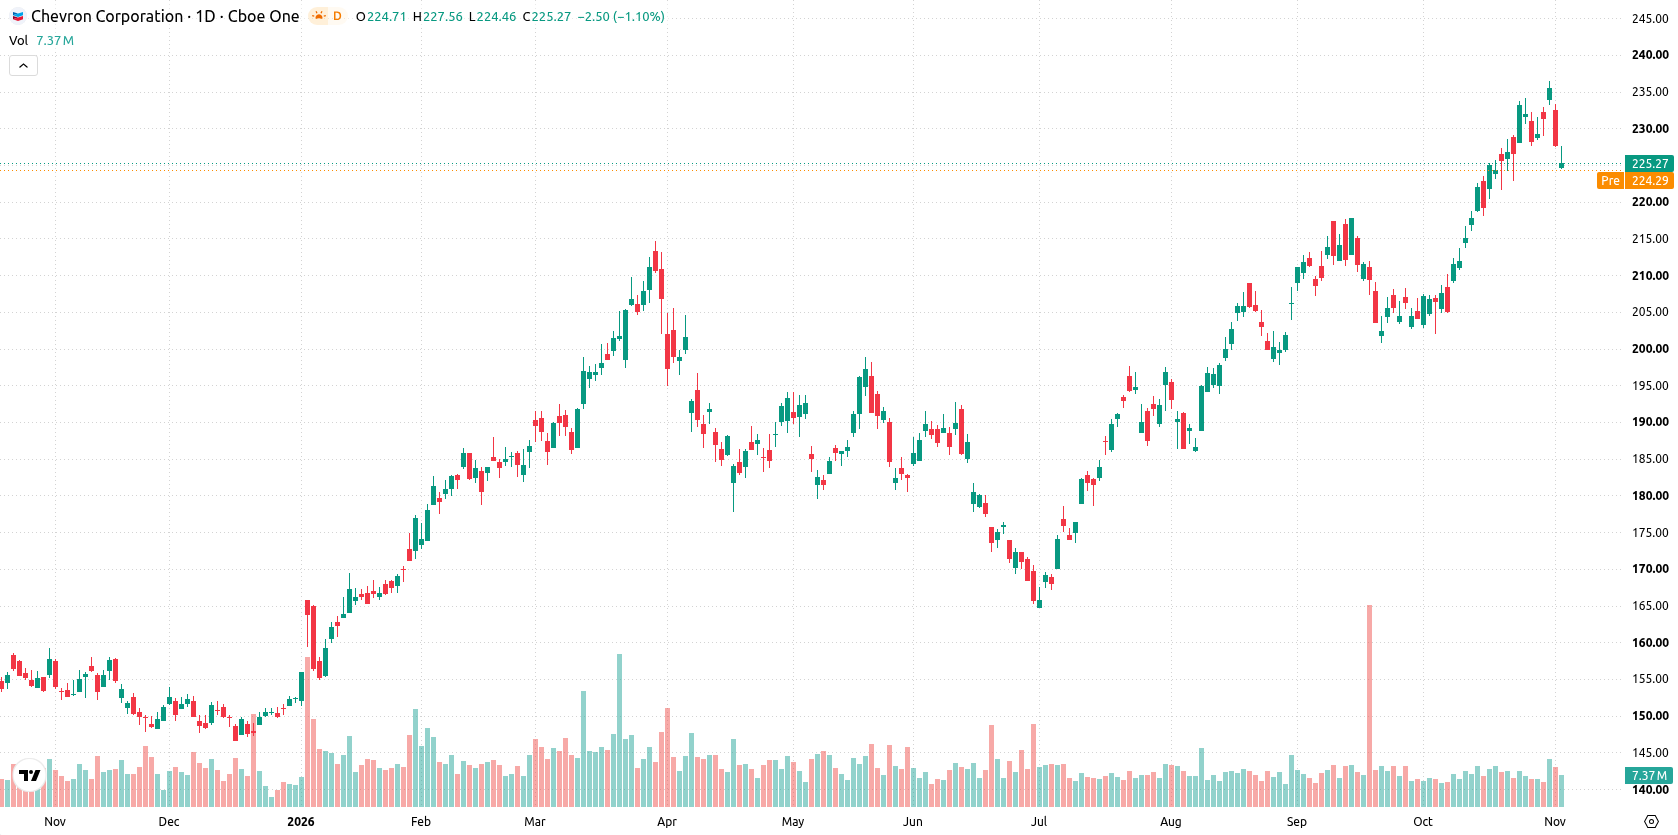
Major support tested as mixed momentum signals follow volatile weekly range
On the daily chart, Chevron is sitting directly on major support at $225.24 after a sharp, volatile week with a 4.98% range. Momentum signals are mixed: the MACD points to a strong buy, while Stochastic RSI is deeply oversold at 0, which could suggest potential rebound risk if sellers tire. Meanwhile, the trend strength is described as developing, with the current momentum character being an emerging move lower that is not yet confirmed. Immediate resistance stands at $236.45, and the Ichimoku Kijun at $219.46 offers further support if the current level fails.
Upside bias persists for next week barring a breakdown of key support
Over the next five trading days, the expected range is $220.23 to $232.04. Probabilities favor an increase (68%) over a decline (32%) within this zone. The base case scenario is for Chevron to consolidate between the established support at $225.24 and resistance at $236.45. A sustained move above $236.45 would open space for further gains, while a close below $225.24 could put the $219.46 Ichimoku Kijun support into play, amplifying downside risk.
Earlier, analysts noted that Chevron’s strong earnings performance had been supporting a resilient technical setup despite persistent selling pressure. The current article adds a new dimension by highlighting mixed momentum signals and an emerging trend shift, bringing attention to $236.45 as the primary level to watch for a potential upside breakout in the days ahead.











-
 Afghanistan
-
 Albania
-
 Algeria
-
 Angola
-
 Argentina
-
 Armenia
-
 Australia
-
 Austria
-
 Azerbaijan
-
 Bahamas
-
 Bahrain
-
 Bangladesh
-
 Belarus
-
 Belgium
-
 Bolivia
-
 Botswana
-
 Brazil
-
 Brunei
-
 Bulgaria
-
 Cambodia
-
 Cameroon
-
 Canada
-
 Chile
-
 China
-
 Colombia
-
 Congo
-
 Costa Rica
-
 Cote d'Ivoire
-
 Croatia
-
 Cuba
-
 Cyprus
-
 Czechia
-
 DR Congo
-
 Denmark
-
 Dominican Republic
-
 Ecuador
-
 Egypt
-
 El Salvador
-
 Estonia
-
 Eswatini
-
 Ethiopia
-
 Finland
-
 France
-
 Georgia
-
 Germany
-
 Ghana
-
 Greece
-
 Haiti
-
 Hong Kong
-
 Hungary
-
 India
-
 Indonesia
-
 Iran, Islamic republic
-
 Iraq
-
 Ireland
-
 Israel
-
 Italy
-
 Jamaica
-
 Japan
-
 Jordan
-
 Kazakhstan
-
 Kenya
-
 Korea
-
 Kuwait
-
 Kyrgyzstan
-
 Laos
-
 Latvia
-
 Lebanon
-
 Lesotho
-
 Libya
-
 Lithuania
-
 Luxembourg
-
 Madagascar
-
 Malaysia
-
 Malta
-
 Mauritius
-
 Mexico
-
 Moldova
-
 Mongolia
-
 Montenegro
-
 Morocco
-
 Mozambique
-
 Myanmar
-
 Namibia
-
 Nepal
-
 Netherlands
-
 New Zealand
-
 Nigeria
-
 North Macedonia
-
 Norway
-
 Oman
-
 Pakistan
-
 Palestine
-
 Panama
-
 Papua New Guinea
-
 Paraguay
-
 Peru
-
 Philippines
-
 Poland
-
 Portugal
-
 Puerto Rico
-
 Qatar
-
 Reunion
-
 Romania
-
 Rwanda
-
 Saudi Arabia
-
 Serbia
-
 Singapore
-
 Slovakia
-
 Slovenia
-
 Somalia
-
 South Africa
-
 Spain
-
 Sri Lanka
-
 Sweden
-
 Switzerland
-
 Syria
-
 Taiwan
-
 Tajikistan
-
 Tanzania
-
 Thailand
-
 Trinidad and Tobago
-
 Tunisia
-
 Turkey
-
 UAE
-
 Uganda
-
 Ukraine
-
 United Kingdom
-
United States
-
 Uruguay
-
 Uzbekistan
-
 Venezuela
-
 Vietnam
-
 Yemen
-
 Zambia
-
 Zimbabwe
- Forex
- Crypto












