

Chevron shares technical analysis: Downward price move with support pressure in focus

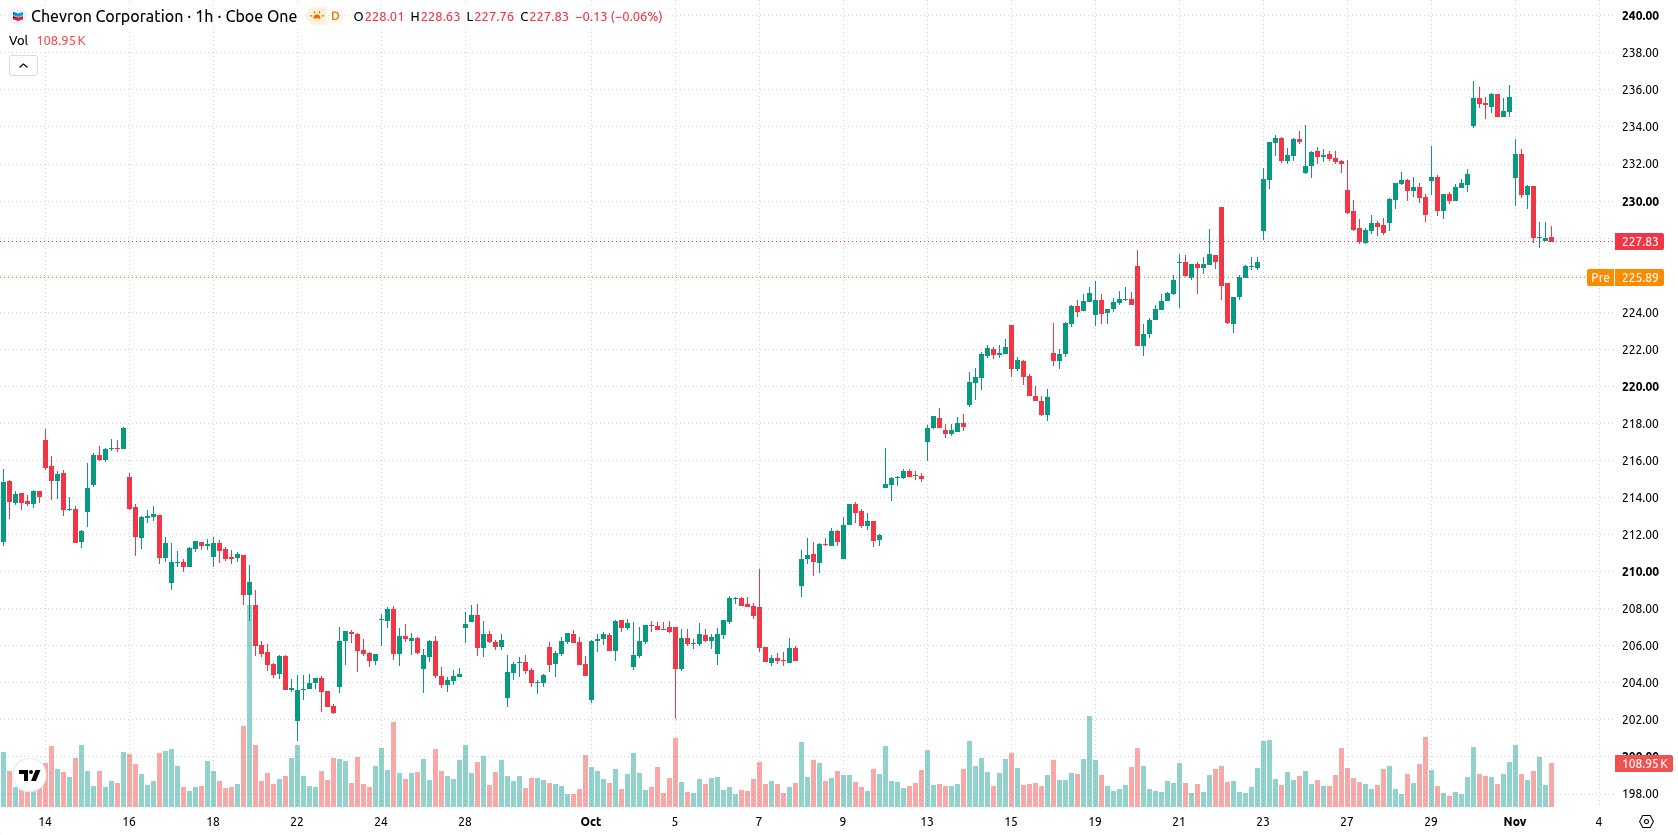
Chevron (CVX) stock is trading at $227.93, down 3.31% for the day following a gap lower and finishing near the session's low. The price is holding above its long-term trend support but sits below key short- and medium-term moving averages.
 209.86
219.88
Highlights
- Chevron reported adjusted third-quarter earnings of $5.28 per share with revenue up 36.3% to $67.8 billion, driven by record U.S. refining throughput and increased Venezuelan output.
- The company kept quarterly share buybacks steady at $2.5 billion to $3 billion and declared a $1.78 per share dividend while lowering net debt.
- Shares of Chevron fell 3.31% to $227.93 with technical signals indicating a bearish tilt and a projected 2 to 3 day trading range of $223.89 to $231.97.
Operational gains and record refinery output offset by sustained equity outflows
Chevron posted better-than-expected third-quarter 2026 results, highlighted by adjusted earnings of $5.28 per share and a 36.3% increase in revenue to approximately $67.8 billion, underpinned by record U.S. refining throughput, robust margins, and expanded Venezuelan production, according to Benzinga. The company also maintained quarterly share repurchases in the $2.5 billion to $3 billion range and declared a $1.78 per share dividend, while substantially reducing its net debt, as noted by Yahoo Finance. These actions reflect solid operational and financial management, though price action has remained under broader selling pressure.
Seller momentum persists as intraday signals flash mixed oversold cues
On the technical front, CVX is trading below the MA-20 and MA-50 on the hourly chart, with the Ichimoku Kijun at $231.95 marking immediate resistance, and remains supported above the MA-200 on the daily timeframe. Momentum readings are mixed: MACD is neutral, ADX shows a sell bias, and Bull/Bear Power is negative, indicating seller dominance intraday. RSI sits in neutral territory, while both Stochastic RSI and CCI are in the oversold zone, hinting that near-term selling may be losing steam. The Awesome Oscillator confirms a bearish tone, with today's move accompanied by a gap lower and a close near the session's low.
Near-term consolidation likely as downside risk outweighs rebound odds
Over the next two to three trading days, CVX is expected to consolidate within a $223.89 to $231.97 range, reflecting typical volatility for the current setup. There is a 58% probability of a further decline versus a 42% chance of a short-term rebound. A move above $231.95 may trigger bullish momentum, while a decisive drop below $223.89 could escalate downside risk in the near term.
Earlier, analysts noted that Chevron’s strong earnings and expanding portfolio had been supporting a bullish technical outlook. The current setup adds a new dimension, as mixed momentum and recent downside price action highlight $231.95 as a key level to watch for any potential shift in near-term trend.






Latest Chevron News





-
 Afghanistan
-
 Albania
-
 Algeria
-
 Angola
-
 Argentina
-
 Armenia
-
 Australia
-
 Austria
-
 Azerbaijan
-
 Bahamas
-
 Bahrain
-
 Bangladesh
-
 Belarus
-
 Belgium
-
 Bolivia
-
 Botswana
-
 Brazil
-
 Brunei
-
 Bulgaria
-
 Cambodia
-
 Cameroon
-
 Canada
-
 Chile
-
 China
-
 Colombia
-
 Congo
-
 Costa Rica
-
 Cote d'Ivoire
-
 Croatia
-
 Cuba
-
 Cyprus
-
 Czechia
-
 DR Congo
-
 Denmark
-
 Dominican Republic
-
 Ecuador
-
 Egypt
-
 El Salvador
-
 Estonia
-
 Eswatini
-
 Ethiopia
-
 Finland
-
 France
-
 Georgia
-
 Germany
-
 Ghana
-
 Greece
-
 Haiti
-
 Hong Kong
-
 Hungary
-
 India
-
 Indonesia
-
 Iran, Islamic republic
-
 Iraq
-
 Ireland
-
 Israel
-
 Italy
-
 Jamaica
-
 Japan
-
 Jordan
-
 Kazakhstan
-
 Kenya
-
 Korea
-
 Kuwait
-
 Kyrgyzstan
-
 Laos
-
 Latvia
-
 Lebanon
-
 Lesotho
-
 Libya
-
 Lithuania
-
 Luxembourg
-
 Madagascar
-
 Malaysia
-
 Malta
-
 Mauritius
-
 Mexico
-
 Moldova
-
 Mongolia
-
 Montenegro
-
 Morocco
-
 Mozambique
-
 Myanmar
-
 Namibia
-
 Nepal
-
 Netherlands
-
 New Zealand
-
 Nigeria
-
 North Macedonia
-
 Norway
-
 Oman
-
 Pakistan
-
 Palestine
-
 Panama
-
 Papua New Guinea
-
 Paraguay
-
 Peru
-
 Philippines
-
 Poland
-
 Portugal
-
 Puerto Rico
-
 Qatar
-
 Reunion
-
 Romania
-
 Rwanda
-
 Saudi Arabia
-
 Serbia
-
 Singapore
-
 Slovakia
-
 Slovenia
-
 Somalia
-
 South Africa
-
 Spain
-
 Sri Lanka
-
 Sweden
-
 Switzerland
-
 Syria
-
 Taiwan
-
 Tajikistan
-
 Tanzania
-
 Thailand
-
 Trinidad and Tobago
-
 Tunisia
-
 Turkey
-
 UAE
-
 Uganda
-
 Ukraine
-
 United Kingdom
-
United States
-
 Uruguay
-
 Uzbekistan
-
 Venezuela
-
 Vietnam
-
 Yemen
-
 Zambia
-
 Zimbabwe
- Forex
- Crypto












